Prison to Employment Strategy in Southern Border Region
This presentation focuses on the prison to employment strategy for the Southern Border Region, highlighting statistics on incarceration rates in California, specifically San Diego and Imperial Counties. It addresses recidivism rates, supervised populations, and measures of recidivism for state prison releases. The data visualizations provide insights into the challenges and disparities related to the criminal justice system in the region.
Download Presentation

Please find below an Image/Link to download the presentation.
The content on the website is provided AS IS for your information and personal use only. It may not be sold, licensed, or shared on other websites without obtaining consent from the author.If you encounter any issues during the download, it is possible that the publisher has removed the file from their server.
You are allowed to download the files provided on this website for personal or commercial use, subject to the condition that they are used lawfully. All files are the property of their respective owners.
The content on the website is provided AS IS for your information and personal use only. It may not be sold, licensed, or shared on other websites without obtaining consent from the author.
E N D
Presentation Transcript
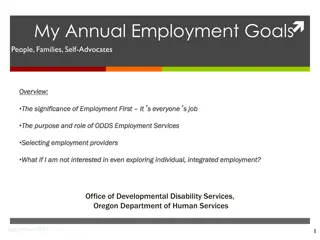
Prison to Employment Strategy for the Southern Border Region Kristen Walker Deona Dorsey Daniel Enemark
1.4% of Californians incarcerated or supervised (11th lowest among states) .6% .5% .4% .3% .2% .1% .% Federal Prison State Prison County Jail Youth Detention State Parole County Probation
San Diego has much larger incarcerated and supervised populations 6,000 5,000 Incarcerated Population 4,000 3,000 2,000 1,000 0 San Diego County Imperial County
16,000 San Diegans Supervised by CDCR & County Probation 28,000 Juvenile Supervision Formal Probation Community/Mandatory Sup State Parolees (estimated) 24,000 20,000 16,000 12,000 8,000 4,000 0 2011 2012 2013 2014 2015 2016
Three Measures of Recidivism for State Prison Releases 100% 80% 60% 40% 3-Year Arrest Rate 3-Year Return-to-Prison Rate 3-Year Conviction Rate 20% % 02-03 03-04 04-05 05-06 06-07 07-08 08-09 09-10 10-11 11-12 12-13 13-14 Fiscal Year
SD & Imperial have very different recidivism rates Imperial Humboldt San Joaquin Tulare Santa Cruz Monterey Napa Sutter Imperial County Santa Clara San Luis San Mateo Butte Mendocino Sacramento Los Angeles Riverside San Benito Del Norte Marin El Dorado Alameda Kings San Francisco Merced San Diego County Conviction Rate in Year 1 Conviction Rate in Year 2 Conviction Rate in Year 3 0% 10% 20% 30% 40% 50% 60% 70% 80%


