Prism Terminology and Light Deviation
Prisms are optical devices that deviate light without changing its vergence. This module explores the various terminology associated with prisms, including Apex, Base, Refracting Angle, and Angle of Deviation. The passage of light through a prism follows Snell's Law, where the ray is deviated toward
5 views • 42 slides
Analysis of Variance (ANOVA) for Testing Multiple Group Differences
Testing for differences among three or more groups can be effectively done using Analysis of Variance (ANOVA). By focusing on variance between means, ANOVA allows for comparison of multiple groups while avoiding issues of dependence and multiple comparisons. Sir Ronald Fisher's ANOVA method provides
3 views • 28 slides

Biometrical Techniques in Animal Breeding: Analysis of Variance in Completely Randomized Design
Biometrical techniques in animal breeding involve the use of analysis of variance (ANOVA) to partition total variance into different components attributable to various factors. In completely randomized designs, experimental units are randomly assigned to treatments, ensuring homogeneity. The total n
2 views • 34 slides
Analysis of Variance in Completely Randomized Design
This content covers the analysis of variance in a completely randomized design, focusing on comparing more than two groups with numeric responses. It explains the statistical methods used to compare groups in controlled experiments and observational studies. The content includes information on 1-way
1 views • 48 slides
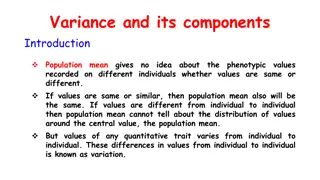
Variance and Its Components in Population Studies
Variance and its components play a crucial role in analyzing the distribution of quantitative traits in populations. By measuring the degree of variation through statistical methods like Measures of Dispersion, researchers can gain insights into the scatterness of values around the mean. Partitionin
1 views • 22 slides
Standard Deviation, Variance, and Z-Scores
Explore the importance of variation in interpreting data distributions, learn how to calculate standard deviation, understand z-scores, and become familiar with Greek letters for mean and standard deviation. Discover the significance of standard deviation in statistical analysis and the difference b
2 views • 18 slides

Measures of Variability: Variance and Standard Deviation
This lesson covers the concepts of variance and standard deviation as measures of variability in a data set. It explains how deviations from the mean are used to calculate variance, and how standard deviation, as the square root of variance, measures the average distance from the mean. Degree of fre
4 views • 26 slides

Standard Deviation in National 5 Mathematics
Standard deviation measures the spread of data around the mean, indicating how close or far apart values are from the average. This concept is crucial in analyzing data variability and consistency, with lower values signifying data clustered around the mean and higher values indicating greater dispe
3 views • 12 slides
The Normal Probability Curve
The Normal Probability Curve, also known as the normal distribution, is a fundamental concept in statistics. It is symmetric around the mean, with key characteristics such as equal numbers of cases above and below the mean, and the mean, median, and mode coinciding. The curve's height decreases grad
1 views • 10 slides
Analysis of Variance (ANOVA) in Animal Genetics & Breeding
ANOVA is a statistical method that partitions the total variance into components attributable to different factors in animal genetics and breeding. This lecture covers the concept of ANOVA, its types, application in Completely Randomized Design, calculations of Sum of Squares, and Mean Squares. It e
0 views • 36 slides
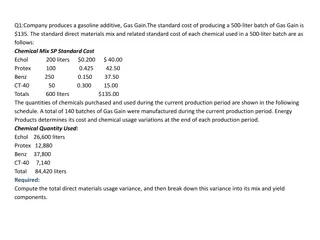
Costing and Variance Analysis in Manufacturing Processes
The content discusses various scenarios related to costing and variance analysis in manufacturing processes. It addresses topics such as direct materials usage variance, direct labor mix and yield variances, total direct labor efficiency variance, and standard costing system variances. The examples
6 views • 8 slides

Discrete Probability Distributions
Explore the definition of random variables, probability distributions, and three types of discrete distributions - Binomial, Hypergeometric, and Poisson. Learn about the mean, variance, and standard deviation of probability distributions, as well as the difference between discrete and continuous dis
5 views • 32 slides
Descriptive Statistics: Mean, Standard Deviation, and Variance
Explore the fundamentals of descriptive statistics focusing on mean, standard deviation, and variance. Dive into the importance of these measures in interpreting data patterns effectively, with practical examples like analyzing the average height of individuals and understanding central tendency met
1 views • 23 slides
Variance Reduction Techniques in Monte Carlo Programs
Understanding variance reduction techniques in Monte Carlo simulations is essential for improving program efficiency. Techniques like biasing, absorption weighting, splitting, and forced collision help reduce variance and enhance simulation accuracy. By adjusting particle weights and distributions,
1 views • 37 slides

Calculating Mean and Standard Deviation of Data Sets
Learn how to find the mean and standard deviation of a set of numbers using a calculator. Follow step-by-step instructions with accompanying images to understand the process. Additionally, an example is provided to calculate the mean and standard deviation of monthly salaries based on a frequency ta
2 views • 13 slides

Arithmetic Mean Calculation Methods
Arithmetic mean can be calculated in individual, discrete, and continuous series. In individual series, each item is listed separately, while in discrete and continuous series, items are grouped with frequencies. The mean can be computed using formulas tailored to each type of series, including meth
0 views • 4 slides
Statistics: Understanding Variance and Standard Deviation
Understand the concepts of population variance, sample variance, and standard deviation. Learn how to calculate these measures for sample and grouped data, and their significance in analyzing data dispersion. Discover the differences between population and sample variance, and when to use each measu
4 views • 11 slides

Approaches to Variance Estimation in Social Policy Research
This lecture discusses approaches to estimating sampling variance and confidence intervals in social policy research, covering topics such as total survey error, determinants of sampling variance, analytical approaches, replication-based approaches, and the ultimate cluster method. Various methods a
1 views • 34 slides
Bias and Variance in Machine Learning
Exploring the concepts of bias and variance in machine learning through informative visuals and explanations. Discover how model space, restricting models, and the impact of bias and variance affect the performance of machine learning algorithms. Formalize bias and variance using mean squared error
0 views • 21 slides
Estimating Population Standard Deviation or Variance in Health Administration Programs
Overview of estimating population standard deviation or variance in health administration programs, including key concepts like point estimates and confidence intervals. Explains critical values of chi-square distribution and provides examples for better understanding.
1 views • 24 slides

Standard Deviation in AP Biology
Standard deviation is a crucial concept in biology that helps analyze variability and distribution of data. This summary provides insights into within-group and between-group variations, normal distribution, and steps to calculate standard deviation using examples and formulas.
1 views • 18 slides
Standard Deviation and Standard Error of the Means
Standard deviation measures the variability or spread of measurements in a data set, while standard error of the means quantifies the precision of the mean of a set of means from replicated experiments. Variability is indicated by the range of data values, with low standard deviation corresponding t
1 views • 7 slides
Introduction to Analysis of Variance
This content covers a detailed explanation of Analysis of Variance (ANOVA), including statistical hypothesis, treatment effects, variability within and between treatments, variance calculations, and temperature conditions analysis. It explores the different factors impacting variance in experimental
0 views • 37 slides

Portfolio theory
In the realm of finance, portfolio theory plays a crucial role in investment decisions by analyzing the relationship between assets and returns. Descriptive statistics, on the other hand, provide valuable insights from data regarding means, variances, and standard deviations. Covariance and correlat
0 views • 11 slides

the Mean in Statistics
The mean in statistics, also known as the average, is a measure of central tendency calculated by summing all values and dividing by the number of values. It represents the middle portion of a distribution and is essential in deriving central tendencies. There are various types of mean such as arith
0 views • 7 slides

Learning Dot Plots and Mean Absolute Deviation
In this lesson, students will explore dot plots and measure variation with mean absolute deviation. They will learn to calculate the mean arm span length using a set of data and understand the characteristics impacting the mean absolute deviation. Essential questions guide the learning process, rein
0 views • 103 slides

Statistical Analysis on Pile Length Data
Calculating range, variation, standard deviation, mean deviation, and skewness measure from a table showing pile lengths and frequencies. The process involves finding the range, variation, mean, mean deviation, and skewness using mathematical formulas. The step-by-step analysis includes determining
0 views • 6 slides

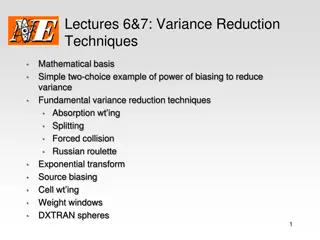
Lectures 6&7: Variance Reduction Techniques
The mathematical basis behind variance reduction techniques in Monte Carlo simulations, focusing on biasing methods for lowering variance. Learn about absorption weighting, forced collision, and other strategies to optimize simulation outcomes. Dive into examples of biasing with probability distribu
0 views • 37 slides

Essential Measures of Dispersion in Biostatistics
Learn about the importance of dispersion in analyzing data variability, explore ideal properties of dispersion measures, and understand commonly used measures like Range, Mean Deviation, Standard Deviation, Variance, Standard Error, and Coefficient of Variation. Discover how to compute range for ind
1 views • 24 slides
Understanding Descriptive Statistics: Mean, Median, Mode, Variance, and Standard Deviation
Learn how to calculate mean, median, mode, variance, and standard deviation using a sample data set of dog heights. Explore the concept of range and understand the significance of each statistical measure in data analysis.
1 views • 16 slides

Understanding Bias, Variance, and the Bias-Variance Tradeoff in Machine Learning and Pattern Recognition
Explore the concepts of bias, variance, and the tradeoff between them in the context of machine learning and pattern recognition. Learn about the No Free Lunch Theorem, bias-variance tradeoff, and measures of generalization. Discover how bias and variance impact the accuracy and precision of learnin
0 views • 11 slides
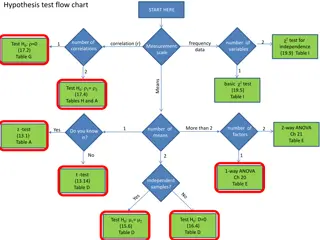
Hypothesis Testing Procedures and Cases: Understanding Mean and Standard Deviation
Explore hypothesis testing procedures including p-value and critical-value approaches, different cases based on known standard deviation, and how to calculate z-values for sample means. Understand when to reject null hypothesis based on p-values in various scenarios.
0 views • 16 slides

Cost Variance Analysis and Management Insights
Explore cost variance analysis, favorable vs. unfavorable variances, significant variances, material cost variances, price variance, and quantity variance in accounting management. Learn how to identify, analyze, and address discrepancies in budgeting and expenses for better financial outcomes.
0 views • 17 slides
Understanding Statistical Bias and Variance in Machine Learning
Learn about the concepts of overfitting, underfitting, the No Free Lunch Theorem, inductive bias assumptions, statistical bias, variance, and the importance of visualizing bias and variance in machine learning models. Gain insights into common assumptions, model complexities, and the impact of bias
0 views • 21 slides
Understanding Measures of Dispersion in Statistics
Learn about the importance of dispersion in statistics and explore different measures such as range, interquartile range, mean deviation, and standard deviation. Discover how to calculate mean deviation from mean with practical examples.
0 views • 12 slides

Understanding Variance in Genetics and Traits
Explore the concept of variance in genetics and traits, including its meaning, implications on trait distribution, interpretability across different distributions, and genetic variance models. Learn about the role of variance in explaining differences in traits between sexes and how transformations
0 views • 8 slides
Understanding Discrete Random Variables and Their Analysis
Learn how to analyze discrete random variables in statistics, including creating histograms, calculating mean and standard deviation, and interpreting probability distributions. Explore the concept of Apgar scores for newborns and how to calculate the expected value of a random variable. Discover th
0 views • 7 slides

Absolute Measure of Dispersion: Mean Deviation Calculation Explained
Discover the concept of mean deviation as an absolute measure of dispersion in statistics. Learn how to calculate mean deviation and its coefficient from mean in individual, discrete, and continuous series, along with visual aids for better understanding.
0 views • 6 slides

Energy Storage Resources: Base Point Deviation Charges Overview
Explore the proposal for a new Base Point Deviation (BPD) settlement system for Energy Storage Resources (ESRs) incorporating tiered deviation tolerances. Learn about the single model ESR registration, SCED base point handling, telemetering, and settlement intervals. Discover the tiered deviation to
0 views • 6 slides

Energy Storage Base Point Deviation Charges Overview
Learn about the new methodology introduced by NPRR963 for calculating Energy Storage Resource Energy Deployment Performance and Base Point Deviation for Generation and Controllable Load Resources in the context of energy storage resources. Discover how the proposed Base Point Deviation Settlement an
0 views • 23 slides