Discrete Probability Distributions
Explore the definition of random variables, probability distributions, and three types of discrete distributions - Binomial, Hypergeometric, and Poisson. Learn about the mean, variance, and standard deviation of probability distributions, as well as the difference between discrete and continuous distributions. Discover how to describe a discrete distribution using the mean or expected value.

Download Presentation

Please find below an Image/Link to download the presentation.
The content on the website is provided AS IS for your information and personal use only. It may not be sold, licensed, or shared on other websites without obtaining consent from the author.If you encounter any issues during the download, it is possible that the publisher has removed the file from their server.
You are allowed to download the files provided on this website for personal or commercial use, subject to the condition that they are used lawfully. All files are the property of their respective owners.
The content on the website is provided AS IS for your information and personal use only. It may not be sold, licensed, or shared on other websites without obtaining consent from the author.
E N D
Presentation Transcript
Discrete Probability Distributions Chapter 5
Goals Definition of random variable and probability distribution; The mean, variance, and standard deviation of a probability distribution; Three types of discrete distributions: Binomial probability distribution; Hypergeometric probability distribution; Poisson probability distribution;
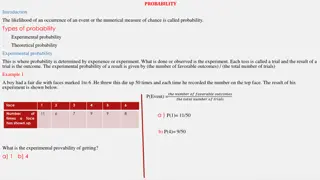
Random Variables In any experiment of chance, the outcomes occur randomly A random variable is a variable that contains the outcomes of a chance experiment Illustration: for experiment of rolling a six-sided die, numbers (1,4,6,3, ) are the values of a random variable; for experiment of measuring the arrivals of cars at a tollbooth during a 30-second period. The possible outcomes are 0, 1, 2, n cars, numbers (0,1,2, n) are the values of a random variable.
Probability Distribution The outcomes for random variables and their associated probabilities can be organized into distributions=> probability distributions The possible outcomes of an experiment involving the roll of a six-sided die are: a one-spot, a two-spot, a three- spot, a four-spot, a five-spot, and a six-spot. Develop a probability distribution for the number of possible spots. Portray the probability distribution graphically. What is the sum of the probabilities? a) b) c)
Discrete and Continuous distributions Discrete random variables => discrete probability distributions A variable that can assume only certain, clearly separated values Usually the result of counting something Examples: The number of cars arriving at a tollbooth Binomial distribution; Hypergeometric distribution; Poisson distribution; Continuous random variables => continuous probability distributions Can assume an infinite number of values within a given range It is usually the result of some type of measurement Examples: The length of each song on the Best of the Beatles album The height of each student in the class Normal distribution; t distribution;
Describing a discrete distribution The mean (or expected value)=> central location of a probability distribution It is a weighted average where the possible values are weighted by their corresponding probabilities of occurrence
The Variance and Standard Deviation of a Probability Distribution Measures the amount of spread or dispersion in a distribution => variance, standard deviation The standard deviation is found by taking the positive square root of the variance = 2
EXAMPLE Mean, Variance and Standard Deviation of discrete probability distribution John Ragsdale sells developed new cars for Pelican Ford. John usually sells the largest number of cars on Saturday. He has the following probability distribution for the number of cars he expects to sell on a particular Saturday
EXAMPLE Mean, Variance and Standard Deviation of discrete probability distribution
EXAMPLE Mean, Variance and Standard Deviation of discrete probability distribution = = . 1 = 2 . 1 317 148
You Try It Out! The Pizza Palace offers three sizes of cola small, medium, and large to go with its pizza. The colas are sold for $0.80, $0.90, and $1.20, respectively. Thirty percent of the orders are for small, 50 percent are for medium, and 20 percent are for the large sizes. Organize the size of the colas and the probability of a sale into a probability distribution. a) Is this a discrete probability distribution? Indicate why or why not. b) Compute the mean amount charged for a cola. c) What is the variance in the amount charged for a cola? The standard deviation?
The Binomial Probability Distribution Characteristics of a Binomial Probability Distribution 1. The experiment involves n identical trials. 2. Each trial has only two possible outcomes denoted as success or as failure . 3. Each trial is independent of the previous trials; 4. The term p remains constant through out the experiment, where p is the probability of getting a success on any one trial.
EXAMPLE The Binomial Probability Distribution Statistics Canada reported recently that approximately 6% of all workers in Canada are unemployed. In conducting a random telephone survey, what is the probability of getting two or fewer unemployed Canadian workers in a sample of 20?
EXAMPLE The Binomial Probability Distribution = . 0 p 06 = p 1 n . 0 94 = 20 = 2 , 1 , 0 + x ( ) 2901 . 0 ( ) . 0 + + = + + 0 20 1 19 2 18 ) 0 ( P 1 2 . 0 ( 0 06 ) . 0 ( 94 ) . 0 ( 1 C 06 ) . 0 ( 94 ) . 0 ( 2 06 ) . 0 ( 94 ) p p C C 20 20 20 = 2246 . 0 + 3703 = 8850 . 0
EXAMPLE Binomial Distributions: Using Appendix A Five percent of the worm gears produced by an automatic, high-speed milling machine are defective. What is the probability that out of six gears selected at random none will be defective? Exactly one? Exactly two? Exactly three? Exactly four? Exactly five? Exactly six out of six?
You Try It Out! Eighty percent of pensioners have their monthly cheques sent directly to their bank by electronic funds transfer. This is also called direct deposit. Suppose we select a random sample of seven recipients. a) Does this situation fit the assumptions of the binomial distribution? b) What is the probability that all seven recipients use direct deposit? c) What is the probability that four of the seven sampled recipients use direct deposit. d) Use Appendix A to verify your answers to parts (b) and (c).
The Mean and Variance of a Binomial Distribution ( ) p = np 1
The Mean and Variance of a Binomial Distribution 64% of all financial consumers believe banks are more competitive today than they were five years ago. If 23 financial consumers are selected randomly, what is the expected number (average) who believe banks are more competitive today than they were five years ago? Average = 14.72
Binomial Shapes for Varying p (n constant)
Binomial Shapes for Varying n (p constant)
Hypergeometric Probability Distribution It has the same characteristics as binomial distribution except the following: If the trials are not independent, ie, a sample is selected from a finite population without replacement n 5%N 1. 2.
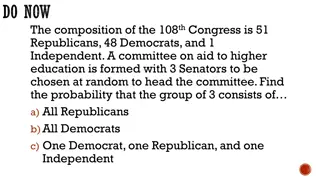
EXAMPLE Hypergeometric Probability Distribution PlayTime Toys Inc. employs 50 people in the Assembly Department. Forty of the employees belong to a union and 10 do not. Five employees are selected at random to form a committee to meet with management regarding shift starting times. What is the probability that four of the five selected for the committee belong to a union? = = 50 , x 40 N S = = , 5 4 n ( )( ) C C = 40 4 50 40 5 4 ) 4 ( P C 50 5 91390 10 ( ) = = . 0 431 2118760
You Try It Out! Horwege Discount Brokers plans to hire five new financial analysts this year. There is a pool of 12 approved applicants, and George Horwege, the owner, decides to randomly select those who will be hired. There are eight men and four women among the approved applicants. What is the probability that three of the five hired are men? N=12, S=8, n=5, x=3
Hypergeometric and Binomial distributions A rule of thumb: if trials are not independent, but n < 5% N, the binomial distribution can be used to approximate the hypergeometric distribution.
The Poisson Distribution The Poisson probability distribution describes the number of times some event occurs during a specified interval. The interval may be time, distance, area, or volume Characteristics: 1. The random variable is the number of times some event occurs during a defined period 2. The probability of the event is proportional to the size of the interval;
Examples of Poisson distribution Number of telephone calls per minute at a small business; Number of hazardous waste sites per province in Canada; Number of cases of a rare blood disease per 100,000 people;
Poisson distribution-example Suppose bank customers arrive randomly on weekday afternoons at an average of 3.2 customers every 4 minutes. What is the probability of exactly five customers arriving in a 4-minute interval on a weekday afternoon? 5 , 2 . 3 = = x 2 . 3 5 x 2 . 3 e e = = = ) 5 ( p 1141 . 0 ! ! 5 x
The Mean and Variance of the Poisson Probability Distribution = 2 np = np = np
EXAMPLE Poisson Probability Distribution Assume baggage is rarely lost by Northwest Airlines. Suppose a random sample of 1,000 flights shows a total of 300 bags were lost. Thus, the arithmetic mean number of lost bags per flight is 0.3 (300/1,000). If the number of lost bags per flight follows a Poisson distribution with u = 0.3, find the probability of not losing any bags.
EXAMPLE Poisson Probability Distribution Table
Poisson Probability Distribution Shape Always positively skewed
Exercises Discrete Probability Distributions Automobiles frequently arrive at the Bronte exit of the QEW at the rate of two per minute. a. what is the probability that no automobiles arrive in a particular minute? b. what is the probability that at least one automobile arrives during a particular minute? Transport Canada has a list of 10 reported safety violations. Suppose only 4 of the reported violations are actual violations and Transport Canada will only be able to investigate five of the violations. What is the probability that three of the five violations randomly selected to be investigated are actually violations?