Graphical representations of linear relationships
This material includes a series of checkpoint activities and additional tasks related to graphical representations of linear relationships for Year 8 students. Students will engage in tasks such as plotting points on coordinate grids, analyzing ant movements, exploring different rules for plotting p
1 views • 51 slides
Industrial Graphics Skills: Applied Subject Overview
Industrial Graphics Studies focuses on graphical communication in various industries like engineering, furnishing, and construction. The course covers 2D and 3D representations, drawing interpretation, symbols, and Australian Standards relevant to graphic representations. Students are assessed throu
1 views • 10 slides
International Nursing Supervision Congress: Perspectives on Nurse Supervisor Social Representations
Explore the evolving landscape of clinical nursing supervision through the lens of social representations developed by nursing students. Understanding the roles and characteristics of nurse supervisors as perceived by students is crucial for enhancing the quality of nursing education and care provis
2 views • 14 slides
Self-Supervised Learning of Pretext-Invariant Representations
This presentation discusses a novel approach in self-supervised learning (SSL) called Pretext-Invariant Representations Learning (PIRL). Traditional SSL methods yield covariant representations, but PIRL aims to learn invariant representations using pretext tasks that make representations similar for
0 views • 8 slides
Introduction to Motion Planning in Autonomous Robotics
Explore the concept of motion planning in autonomous robotics through graphical representations called roadmaps. Understand the importance of representation, transformations, and problem instances in motion planning algorithms. Learn about the accessibility and connectivity characteristics of roadma
0 views • 64 slides
Understanding the Concept of Return to Factor in Production Economics
Return to Factor is a key concept in production economics that explains the relationship between variable inputs like labor and total production output. The concept is based on the three stages of production - increasing returns, diminishing returns, and negative returns. By analyzing the behavior o
0 views • 7 slides
The Evolution of Graphical User Interfaces in Computing
Graphical User Interfaces (GUIs) have transformed computing into a more user-friendly and interactive experience, emphasizing the shift from technology-focused to human-centric living. This chapter delves into the various aspects of GUIs, including I/O alternatives, common GUI tasks, programming per
1 views • 32 slides
Understanding Network Perturbations in Computational Biology
Network-based interpretation and integration play a crucial role in understanding genetic perturbations in biological systems. Perturbations in networks can affect nodes or edges, leading to valuable insights into gene function and phenotypic outcomes. Various algorithms, such as graph diffusion and
0 views • 55 slides
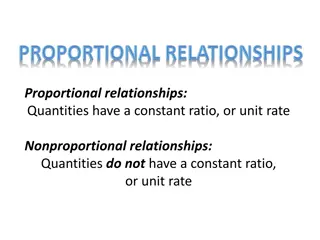
Understanding Proportional and Nonproportional Relationships in Mathematics
Proportional relationships involve quantities having a constant ratio or unit rate, while nonproportional relationships lack this constant ratio. By examining examples such as earnings from babysitting and costs of movie rentals, we can grasp the differences between these two types of relationships.
2 views • 6 slides
The Joy of Sets: Graphical Alternatives to Euler and Venn Diagrams
Graphical representations of set membership can be effectively portrayed using alternatives to traditional Euler and Venn diagrams. Learn about upset plots, indicating set membership graphically, and the use of Venn or Euler diagrams as solutions. Explore the historical context and challenges with V
2 views • 43 slides
Understanding Resolutions and Triangle of Forces in Physics
Resolutions of forces involve breaking down a force into components, while the Triangle of Forces explores how forces interact in equilibrium. By analyzing graphical and mathematical representations, you can determine the resultant force and its direction using trigonometric functions. Applying the
1 views • 11 slides
Realistic Particle Representations and Interactions in Emission & Regeneration UFT
The presentation explores a model in which particles are depicted as focal points in space, proposed by Osvaldo Domann. It delves into theoretical particle representations, motivation for a new approach, and the methodology behind the Postulated model. Additionally, it delves into particle represent
1 views • 24 slides
Visualizing Real Numbers on a Number Line by Successive Magnification
Visualization techniques for representing real numbers on a number line through successive magnification are demonstrated step by step. The procedure involves dividing the line into equal parts and zooming in on specific ranges to accurately locate decimal values. This method helps in understanding
0 views • 12 slides
Understanding Linear Transformations and Matrices in Mathematics
Linear transformations play a crucial role in the study of vector spaces and matrices. They involve mapping vectors from one space to another while maintaining certain properties. This summary covers the introduction to linear transformations, the kernel and range of a transformation, matrices for l
0 views • 85 slides
Understanding Roots of Equations in Engineering: Methods and Techniques
Roots of equations are values of x where f(x) = 0. This chapter explores various techniques to find roots, such as graphical methods, bisection method, false position method, fixed-point iteration, Newton-Raphson method, and secant method. Graphical techniques provide rough estimates, while numerica
0 views • 13 slides
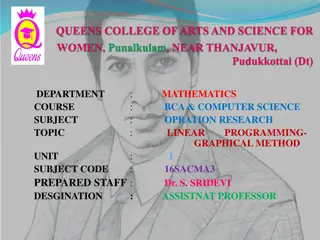
Linear Programming - Graphical Method in Operations Research
This presentation explores the application of linear programming using the graphical method in the field of Operations Research. Dr. S. Sridevi, Assistant Professor, delves into the concepts and techniques involved in solving optimization problems through graphical representations. The slides cover
0 views • 24 slides
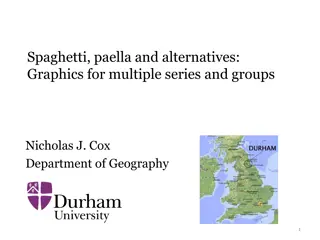
Strategies for Effective Data Visualization
This talk by Nicholas J. Cox explores strategies to enhance data visualization for better interpretation and comparison. From spaghetti plots to front-and-back plots, various techniques are discussed to improve the clarity and effectiveness of graphical presentations. The presentation emphasizes the
1 views • 47 slides
Enhancing Mathematical Thinking Through Connecting Representations
Explore the instructional routine of connecting representations to promote structural thinking in mathematics. Discover how to connect solutions to graphs, analyze similarities/differences, share connections, create representations, and reflect on learning. Encourage critical thinking and deeper und
0 views • 10 slides
Visual Snippets: Summarizing Web Pages for Search and Revisitation
This study explores various ways to represent web pages for efficient search and revisitation, focusing on the best representation for recognition and search purposes. The research delves into designer-created representations, auto-generated visual snippets, and strategies for studying representatio
0 views • 16 slides
Understanding GPolygon Class in Graphical Structures
The GPolygon class in graphical structures is utilized to represent graphical objects bounded by line segments, such as polygons. This class allows for the creation of polygons with vertices connected by edges, utilizing methods like addVertex and addEdge to construct the shape. The reference point
0 views • 26 slides
Graphical Method for Velocity Analysis of Planar Mechanisms
Learn about the graphical method for velocity analysis of planar mechanisms through practice problems involving slider-crank mechanisms and link velocities. Understand how to calculate slider velocity, point velocity, and angular velocities using the given dimensions and rotational speeds. Visualize
0 views • 6 slides
Understanding Graphical User Interfaces in Java
Learn about designing graphical user interfaces in Java, including layout management, common components like radio buttons and menus, browsing Java documentation effectively, and utilizing inheritance for complex frames. Explore topics such as using layout managers to organize UI components, creatin
0 views • 74 slides
Understanding Java Swing for Building Graphical User Interfaces
Java Swing is a powerful framework for creating graphical user interface applications in Java. It provides a wide array of visual components such as JFrame, JComponent, and JPanel, enabling developers to build interactive and visually appealing applications easily. With Swing, developers can design
1 views • 25 slides
Exploring Graphical User Interfaces (GUIs) and JOptionPane in Java
Introduction to Object-Oriented Programming (OOP) and GUI concepts in Java, focusing on GUI hierarchy, designing GUIs, working with containers and components, utilizing JOptionPane for graphical input/output, and examples of showMessageDialog and showConfirmDialog in Java applications.
0 views • 90 slides
Exploring Graphs: Visualizations and Representations in Java
Delve into the world of graphs with a focus on visualizations for networks and building up graph representations in Java. Explore different graph representations, adjacency lists, and key-value mappings, along with insights on storing and tracking data efficiently using Java data structures. Dive in
0 views • 12 slides
Insights into Graphical Representation of Data in Business Mathematics
Graphical representation of data in Business Mathematics is a powerful tool that provides a bird's eye view of statistical information. It enables easy visualization of variations in variables, aiding in understanding time series and frequency distributions efficiently. While graphs offer quick esti
0 views • 18 slides
Introduction to R Programming: Statistical & Graphical Methods
R is a programming language developed in 1993 by Ross Ihaka and Robert Gentleman. It offers a wide range of statistical and graphical methods, making it a powerful tool for data analysis and visualization.
0 views • 35 slides
Introduction to Graphical User Interfaces (GUIs) in Python for Geographical Information Analysis
This content provides insights into creating Graphical User Interfaces (GUIs) in Python for Geographical Information Analysis. It covers the basics of GUI development using TkInter and event-based programming with a focus on user experience design and functionality. The lecture emphasizes the import
0 views • 45 slides
Probabilistic Graphical Models Part 2: Inference and Learning
This segment delves into various types of inferences in probabilistic graphical models, including marginal inference, posterior inference, and maximum a posteriori inference. It also covers methods like variable elimination, belief propagation, and junction tree for exact inference, along with appro
0 views • 33 slides
Developing a Graphical User Interface for High-Resolution X-ray Spectra Analysis
High-resolution X-ray spectra analysis can be challenging due to the complex nature of the information contained within. This project aims to simplify the process by developing a user-friendly graphical interface that enables users to visualize, analyze, and interpret X-ray spectra data effectively.
0 views • 19 slides
Quantum Deep Learning: Challenges and Opportunities in Artificial Intelligence
Quantum deep learning explores the potential of using quantum computing to address challenges in artificial intelligence, focusing on learning complex representations for tough AI problems. The quest is to automatically learn representations at both low and high levels, leveraging terabytes of web d
0 views • 14 slides
Graphical Models and Belief Propagation in Computer Vision
Identical local evidence can lead to different interpretations in computer vision, highlighting the importance of propagating information effectively. Probabilistic graphical models serve as a powerful tool for this purpose, enabling the propagation of local information within an image. This lecture
0 views • 50 slides
Exploring the Graphics Library for Enhanced User Interaction in Python
Explore the Zelle graphics library in Python for creating interactive graphical user interfaces. Learn about classes like GraphWin, Point, Line, Circle, Rectangle, Oval, Polygon, Text, Entry, and Image to enhance the visual appeal of your programs and engage users in a more intuitive manner. Utilize
0 views • 25 slides
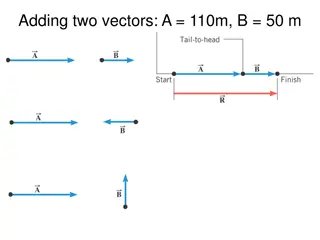
Graphical Technique for Adding Vectors - Example of Total Displacement Calculation
Example illustrating the graphical technique for adding vectors to determine the total displacement of a person walking three different paths on a flat field. The person walks specific distances in various directions, and the total displacement is calculated using head-to-tail method.
0 views • 11 slides
Understanding Probabilistic Graphical Models in Real-world Applications
Probabilistic Graphical Models (PGMs) offer a powerful framework for modeling real-world uncertainties and complexities using probability distributions. By incorporating graph theory and probability theory, PGMs allow flexible representation of large sets of random variables with intricate relations
1 views • 30 slides
Introduction to Creating Graphical User Interfaces in MATLAB
Explore the world of creating Graphical User Interfaces (GUIs) in MATLAB with this informative guide. Learn how to design GUIs, program them to respond to user actions, and launch them effortlessly. Dive into essential topics such as GUI creation, component layout, and programming details, all witho
0 views • 40 slides
Introduction to Graphical User Interface (GUI) in MATLAB
A graphical user interface (GUI) allows users to interact with software using visual elements like menus, buttons, and icons, instead of text-based commands. In MATLAB, GUIs consist of two main files - an .m file for code and a .fig file for graphical elements. GUIs enable users to interact with MAT
0 views • 50 slides
Graphical Solutions of Autonomous Equations in Mathematics II
Explore the graphical solutions of autonomous equations in Mathematics II taught by lecturer Wisam Hayder at Diyala University's College of Engineering. Learn about phase lines, equilibrium values, construction of graphical solutions, and sketching solution curves using phase lines. Dive into exampl
0 views • 34 slides
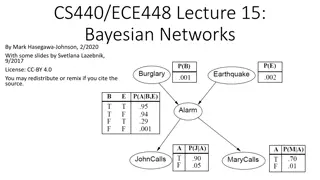
Understanding Bayesian Networks for Efficient Probabilistic Inference
Bayesian networks, also known as graphical models, provide a compact and efficient way to represent complex joint probability distributions involving hidden variables. By depicting conditional independence relationships between random variables in a graph, Bayesian networks facilitate Bayesian infer
0 views • 33 slides
Understanding Graphical Representations and Scale in Learning
Explore the similarities and differences of various graphical representations, apply scale in context, solve problems involving scale. Includes warm-up activities, launch on Mount Kosciuszko summit walk, and analyzing floor plans. Success criteria emphasize reading and problem-solving skills related
0 views • 9 slides


