
Graphical representations of linear relationships
This material includes a series of checkpoint activities and additional tasks related to graphical representations of linear relationships for Year 8 students. Students will engage in tasks such as plotting points on coordinate grids, analyzing ant movements, exploring different rules for plotting p
1 views • 51 slides
The Evolution of Graphical User Interfaces in Computing
Graphical User Interfaces (GUIs) have transformed computing into a more user-friendly and interactive experience, emphasizing the shift from technology-focused to human-centric living. This chapter delves into the various aspects of GUIs, including I/O alternatives, common GUI tasks, programming per
2 views • 32 slides
Network Perturbations in Computational Biology
Network-based interpretation and integration play a crucial role in understanding genetic perturbations in biological systems. Perturbations in networks can affect nodes or edges, leading to valuable insights into gene function and phenotypic outcomes. Various algorithms, such as graph diffusion and
1 views • 55 slides

The Joy of Sets: Graphical Alternatives to Euler and Venn Diagrams
Graphical representations of set membership can be effectively portrayed using alternatives to traditional Euler and Venn diagrams. Learn about upset plots, indicating set membership graphically, and the use of Venn or Euler diagrams as solutions. Explore the historical context and challenges with V
3 views • 43 slides

Roots of Equations in Engineering: Methods and Techniques
Roots of equations are values of x where f(x) = 0. This chapter explores various techniques to find roots, such as graphical methods, bisection method, false position method, fixed-point iteration, Newton-Raphson method, and secant method. Graphical techniques provide rough estimates, while numerica
1 views • 13 slides
Linear Programming - Graphical Method in Operations Research
This presentation explores the application of linear programming using the graphical method in the field of Operations Research. Dr. S. Sridevi, Assistant Professor, delves into the concepts and techniques involved in solving optimization problems through graphical representations. The slides cover
0 views • 24 slides

Strategies for Effective Data Visualization
This talk by Nicholas J. Cox explores strategies to enhance data visualization for better interpretation and comparison. From spaghetti plots to front-and-back plots, various techniques are discussed to improve the clarity and effectiveness of graphical presentations. The presentation emphasizes the
2 views • 47 slides
GPolygon Class in Graphical Structures
The GPolygon class in graphical structures is utilized to represent graphical objects bounded by line segments, such as polygons. This class allows for the creation of polygons with vertices connected by edges, utilizing methods like addVertex and addEdge to construct the shape. The reference point
1 views • 26 slides
Graphical Method for Velocity Analysis of Planar Mechanisms
Learn about the graphical method for velocity analysis of planar mechanisms through practice problems involving slider-crank mechanisms and link velocities. Understand how to calculate slider velocity, point velocity, and angular velocities using the given dimensions and rotational speeds. Visualize
0 views • 6 slides
Graphical User Interfaces in Java
Learn about designing graphical user interfaces in Java, including layout management, common components like radio buttons and menus, browsing Java documentation effectively, and utilizing inheritance for complex frames. Explore topics such as using layout managers to organize UI components, creatin
0 views • 74 slides
Java Swing for Building Graphical User Interfaces
Java Swing is a powerful framework for creating graphical user interface applications in Java. It provides a wide array of visual components such as JFrame, JComponent, and JPanel, enabling developers to build interactive and visually appealing applications easily. With Swing, developers can design
2 views • 25 slides

Graphical User Interfaces (GUIs) and JOptionPane in Java
Introduction to Object-Oriented Programming (OOP) and GUI concepts in Java, focusing on GUI hierarchy, designing GUIs, working with containers and components, utilizing JOptionPane for graphical input/output, and examples of showMessageDialog and showConfirmDialog in Java applications.
0 views • 90 slides
Insights into Graphical Representation of Data in Business Mathematics
Graphical representation of data in Business Mathematics is a powerful tool that provides a bird's eye view of statistical information. It enables easy visualization of variations in variables, aiding in understanding time series and frequency distributions efficiently. While graphs offer quick esti
0 views • 18 slides
Introduction to R Programming: Statistical & Graphical Methods
R is a programming language developed in 1993 by Ross Ihaka and Robert Gentleman. It offers a wide range of statistical and graphical methods, making it a powerful tool for data analysis and visualization.
0 views • 35 slides

Introduction to Graphical User Interfaces (GUIs) in Python for Geographical Information Analysis
This content provides insights into creating Graphical User Interfaces (GUIs) in Python for Geographical Information Analysis. It covers the basics of GUI development using TkInter and event-based programming with a focus on user experience design and functionality. The lecture emphasizes the import
4 views • 45 slides
Probabilistic Graphical Models Part 2: Inference and Learning
This segment delves into various types of inferences in probabilistic graphical models, including marginal inference, posterior inference, and maximum a posteriori inference. It also covers methods like variable elimination, belief propagation, and junction tree for exact inference, along with appro
1 views • 33 slides

Developing a Graphical User Interface for High-Resolution X-ray Spectra Analysis
High-resolution X-ray spectra analysis can be challenging due to the complex nature of the information contained within. This project aims to simplify the process by developing a user-friendly graphical interface that enables users to visualize, analyze, and interpret X-ray spectra data effectively.
0 views • 19 slides
Graphical Models and Belief Propagation in Computer Vision
Identical local evidence can lead to different interpretations in computer vision, highlighting the importance of propagating information effectively. Probabilistic graphical models serve as a powerful tool for this purpose, enabling the propagation of local information within an image. This lecture
0 views • 50 slides
Graphics Library for Enhanced User Interaction in Python
Explore the Zelle graphics library in Python for creating interactive graphical user interfaces. Learn about classes like GraphWin, Point, Line, Circle, Rectangle, Oval, Polygon, Text, Entry, and Image to enhance the visual appeal of your programs and engage users in a more intuitive manner. Utilize
1 views • 25 slides
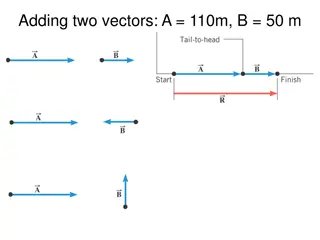
Graphical Technique for Adding Vectors - Example of Total Displacement Calculation
Example illustrating the graphical technique for adding vectors to determine the total displacement of a person walking three different paths on a flat field. The person walks specific distances in various directions, and the total displacement is calculated using head-to-tail method.
0 views • 11 slides
Probabilistic Graphical Models in Real-world Applications
Probabilistic Graphical Models (PGMs) offer a powerful framework for modeling real-world uncertainties and complexities using probability distributions. By incorporating graph theory and probability theory, PGMs allow flexible representation of large sets of random variables with intricate relations
1 views • 30 slides
Introduction to Creating Graphical User Interfaces in MATLAB
Explore the world of creating Graphical User Interfaces (GUIs) in MATLAB with this informative guide. Learn how to design GUIs, program them to respond to user actions, and launch them effortlessly. Dive into essential topics such as GUI creation, component layout, and programming details, all witho
2 views • 40 slides
Introduction to Graphical User Interface (GUI) in MATLAB
A graphical user interface (GUI) allows users to interact with software using visual elements like menus, buttons, and icons, instead of text-based commands. In MATLAB, GUIs consist of two main files - an .m file for code and a .fig file for graphical elements. GUIs enable users to interact with MAT
0 views • 50 slides
Graphical Solutions of Autonomous Equations in Mathematics II
Explore the graphical solutions of autonomous equations in Mathematics II taught by lecturer Wisam Hayder at Diyala University's College of Engineering. Learn about phase lines, equilibrium values, construction of graphical solutions, and sketching solution curves using phase lines. Dive into exampl
0 views • 34 slides
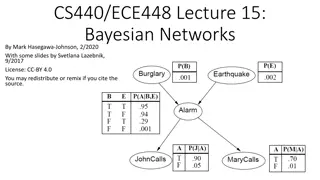
Bayesian Networks for Efficient Probabilistic Inference
Bayesian networks, also known as graphical models, provide a compact and efficient way to represent complex joint probability distributions involving hidden variables. By depicting conditional independence relationships between random variables in a graph, Bayesian networks facilitate Bayesian infer
0 views • 33 slides
Graphical Representations and Scale in Learning
Explore the similarities and differences of various graphical representations, apply scale in context, solve problems involving scale. Includes warm-up activities, launch on Mount Kosciuszko summit walk, and analyzing floor plans. Success criteria emphasize reading and problem-solving skills related
0 views • 9 slides

Anti-Shoulder Surfing based Authentication Mechanism using Graphical Passwords
Authentication plays a crucial role in system accessibility, with strong passwords being a major concern. This research focuses on proposing an anti-shoulder surfing mechanism using graphical passwords to enhance security. Existing techniques like Triangle Scheme, Convex Hull, Intersection Scheme, a
0 views • 10 slides
PYTHON FOR NUMERICAL COMPUTING AND DEVELOPMENT OF SCIENTIFIC APPLICATION
This program focuses on Python for numerical computing and developing scientific applications. It covers Command Line Interface (CLI) and Graphical User Interface (GUI), highlighting their differences and functionalities. CLI involves text-based interactions through a command prompt, offering more c
0 views • 24 slides

Sensitivity in SuperDecisions
Graphical sensitivity in SuperDecisions by varying priorities of criteria in hierarchies to analyze impacts on alternatives. See demonstrations with the Car Hierarchy model. Learn how to perform graphical sensitivity analysis and interpret the results effectively. Gain insights into dynamic sensitiv
0 views • 21 slides
Introduction to Graphical User Interfaces in Python Programming
This content provides an introduction to Graphical User Interfaces (GUIs) in Python programming, emphasizing the use of TkInter for building GUI applications. It covers basic GUI components, event-based programming, user experience design considerations, and tips for designing GUIs for users. The di
1 views • 45 slides
Probabilistic Graphical Models
The intersection of intelligent agents, web mining, and probabilistic graphical models in Tanya Braun's insightful work. Dive into the realm of cutting-edge technology and data analysis techniques that are shaping the future of artificial intelligence and information retrieval. Gain valuable insight
0 views • 6 slides
Describing Bivariate Data: Graphical Analysis and Interpretation
Bivariate data analysis involves exploring the relationship between two variables through graphical representations such as comparative bar charts, line charts, and scatterplots. These visualizations help in understanding patterns, strength of relationships, and identifying outliers or clusters in t
0 views • 26 slides
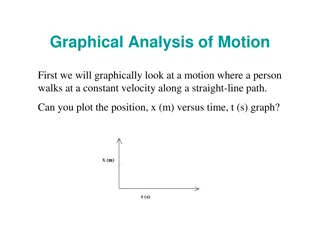
Graphical Analysis of Motion
Graphical analysis of motion through position vs. time and velocity vs. time graphs. Understand concepts like constant velocity, acceleration, and displacement using graphical representations. Dive into scenarios such as a person walking, a bicycle trip, and a car's motion. Discover how slopes and a
0 views • 8 slides

Graphical User Interface: Windows and Control Elements
In computing, a window is a graphical control element that forms part of the graphical user interface of a program. This element can display and receive input from processes, with options to minimize, maximize, restore, and close windows. Users can move and resize windows to suit their needs, enhanc
0 views • 10 slides
Graphical Linear Programming Methods and Constraints Analysis
Explore the fundamentals of graphical methods in linear programming, understanding linear inequalities visualization, finding feasible regions, and determining optimal solutions. Dive into binding and nonbinding constraints, convex sets, and extreme points in LP problems.
0 views • 19 slides
Effective Graphical Representation Methods for Frequency Distribution
Learn about graphical methods used to present quantitative data effectively through graphical representation such as histograms, frequency curves, and more. Understand how to construct histograms for equal and unequal class intervals with practical examples.
1 views • 25 slides
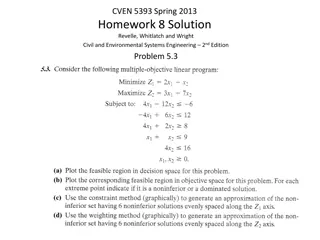
Solution for Multiobjective Optimization Problem with Graphical Constraint Method
Explore the solution to a multiobjective optimization problem using graphical methods and constraint analysis. The process involves plotting feasible regions, identifying noninferior solutions, constructing payoff tables, and generating approximations of the non-inferior set. Various constraints are
0 views • 10 slides
Graphical Optimization Methods and Examples in Mathematics
Explore graphical optimization methods, constraints plotting, feasible regions, and finding optimum solutions. Learn about different optimization methods like graphical, calculus-based, and search-based approaches. Dive into practical examples to understand the concepts better.
0 views • 19 slides
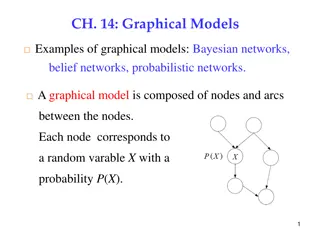
Graphical Models in Bayesian Networks: Examples and Concepts
Explore the world of graphical models, such as Bayesian networks and belief networks, which use nodes and arcs to represent random variables and their dependencies. Learn how to calculate joint probabilities and make causal and diagnostic inferences using graphical models.
0 views • 41 slides
Estimation of Graphical Models Using Generalized Covariance Matrices
Explore the structure estimation for discrete graphical models by analyzing the relationships between conditional independence and inverse covariance matrices. The extension of Gaussian graphical models, Ising models, and more is discussed, providing insights into graph structures based on covarianc
0 views • 16 slides