Graphical Analysis of Motion
G
r
a
p
h
i
c
a
l
A
n
a
l
y
s
i
s
o
f
M
o
t
i
o
n
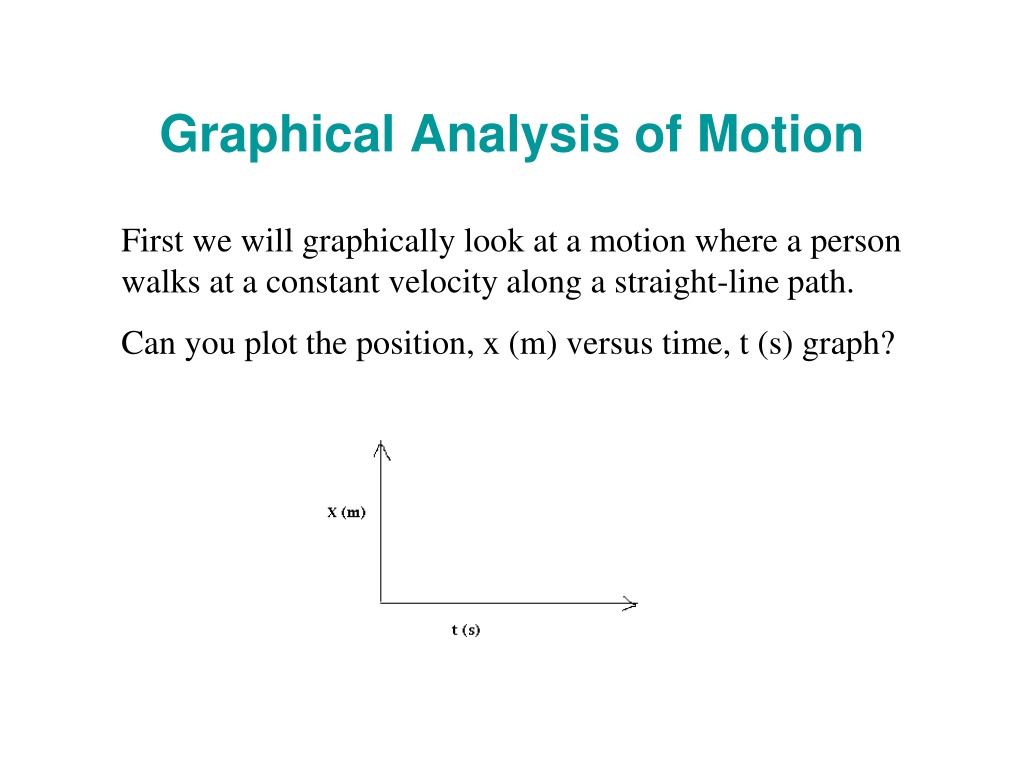
First we will graphically look at a motion where a person
walks at a constant velocity along a straight-line path.
Can you plot the position, x (m) versus time, t (s) graph?
P
o
s
i
t
i
o
n
V
S
.
T
i
m
e
g
r
a
p
h
What is the slope of the position VS. time graph?
P
o
s
i
t
i
o
n
V
S
.
T
i
m
e
g
r
a
p
h
The position VS. time graph for an object moving with constant
velocity is shown below.
a.
How will you modify the graph if the object accelerates.
b.
How will you modify the graph if the object decelerates.
The 100-m Dash
E
X
A
M
P
L
E
1
6
A
B
i
c
y
c
l
e
T
r
i
p
A bicyclist maintains a constant
velocity
on the outgoing leg of a journey,
zero velocity while stopped for lunch, and another constant velocity on the
way back.
V
e
l
o
c
i
t
y
v
e
r
s
u
s
T
i
m
e
g
r
a
p
h
A car is moving along a straight-line path starting from rest at a
constant acceleration. Once the car reaches a velocity of 45
MPH, that velocity is maintained for a while. Finally the brakes
are applied with a constant deceleration and the car comes to
rest.
Can you plot Velocity VS. Time for the car?
V
e
l
o
c
i
t
y
V
S
.
T
i
m
e
The slope of the velocity versus time graph is the
acceleration.
The area under the velocity versus time graph is the
displacement.
P
r
o
b
l
e
m
A snowmobile moves according to the velocity-time graph
shown in the drawing.
a.
What is the snowmobile’s average acceleration during each
of the segments
A
,
B
, and
C
?
b.
How far it travels during each of the segments
A
,
B
, and
C
?
Graphical analysis of motion through position vs. time and velocity vs. time graphs. Understand concepts like constant velocity, acceleration, and displacement using graphical representations. Dive into scenarios such as a person walking, a bicycle trip, and a car's motion. Discover how slopes and areas under the graphs relate to velocity, acceleration, and displacement.

Download Presentation

Please find below an Image/Link to download the presentation.
The content on the website is provided AS IS for your information and personal use only. It may not be sold, licensed, or shared on other websites without obtaining consent from the author.If you encounter any issues during the download, it is possible that the publisher has removed the file from their server.
You are allowed to download the files provided on this website for personal or commercial use, subject to the condition that they are used lawfully. All files are the property of their respective owners.
The content on the website is provided AS IS for your information and personal use only. It may not be sold, licensed, or shared on other websites without obtaining consent from the author.
E N D
Presentation Transcript
Graphical Analysis of Motion First we will graphically look at a motion where a person walks at a constant velocity along a straight-line path. Can you plot the position, x (m) versus time, t (s) graph?
Position VS. Time graph What is the slope of the position VS. time graph? Rise X = = = Slope Velocity Run t
Position VS. Time graph The position VS. time graph for an object moving with constant velocity is shown below. a. How will you modify the graph if the object accelerates. b. How will you modify the graph if the object decelerates.
EXAMPLE 16 A Bicycle Trip A bicyclist maintains a constant velocity on the outgoing leg of a journey, zero velocity while stopped for lunch, and another constant velocity on the way back.
Velocity versus Time graph A car is moving along a straight-line path starting from rest at a constant acceleration. Once the car reaches a velocity of 45 MPH, that velocity is maintained for a while. Finally the brakes are applied with a constant deceleration and the car comes to rest. Can you plot Velocity VS. Time for the car?
Velocity VS. Time The slope of the velocity versus time graph is the acceleration. Rise Slope = V = = Accelerati on Run t The area under the velocity versus time graph is the displacement.
Problem A snowmobile moves according to the velocity-time graph shown in the drawing. a. What is the snowmobile s average acceleration during each of the segments A, B, and C? b. How far it travels during each of the segments A, B, and C?