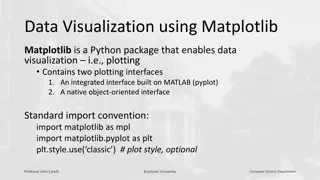
Data Visualization with Matplotlib in Python
Matplotlib is a powerful Python package for data visualization, offering both an integrated interface (pyplot) and a native object-oriented interface. This tool enables users to create various types of plots and gives control over the visualization process. Learn about basic operations, differences
7 views • 19 slides
Geospatial Knowledge: Shaping the Future of Digital Society
Exploring the pivotal role of geospatial knowledge in tomorrow's global digital society, the Geospatial Knowledge Infrastructure (GKI) Project aims to advance the integration of digital economies, societies, and citizens through location-based services and technologies. With a focus on stakeholder e
1 views • 23 slides
Overview of AFRIGIST's Capacity Building Activities
AFRIGIST, the African Regional Institute for Geospatial Information Science and Technology, aims to provide quality training and education in geospatial science to enhance sustainable development in Africa. Established under the United Nations Economic Commission for Africa, AFRIGIST focuses on deve
1 views • 20 slides
Open Source Chat Based Data Visualization With Helical Insight
Open Source Chat Based Data Visualization plays a pivotal role in modern business operations, enabling organizations to derive insights, make informed decisions, and drive growth. However, traditional visualization tools often come with high costs and steep learning curves, limiting accessibility an
1 views • 2 slides
Benefits of Open Source Chat-based Data Visualization
In the realm of Business Intelligence (BI), data visualization plays a pivotal role in transforming raw data into actionable insights. Traditional BI tools often require users to possess technical expertise in querying databases and creating visualizations. However, the emergence of open source chat
1 views • 2 slides
Open Source Alternative to Tableau for Data Visualization in 2024
As businesses increasingly rely on data-driven decisions, the demand for powerful data visualization tools continues to grow. Tableau has long been a leader in this space, known for its robust capabilities and user-friendly interface. However, open-source alternatives are gaining traction due to the
0 views • 2 slides
Reusing Phylogenetic Data for Enhanced Visualization and Analysis
Reusing phylogenetic data can revolutionize scientific research by enabling synthesis of knowledge and comparative analyses across scientific disciplines. However, a significant portion of valuable phylogenetic data is lost due to the prevalent use of static images for tree publication. To address t
0 views • 8 slides
Evolution of ASPRS Positional Accuracy Standards for Geospatial Data
New technological advancements have prompted the need for updated ASPRS positional accuracy standards for digital geospatial data. Legacy standards from the 1990s are no longer sufficient given the shift towards modern mapping technologies. The new era of mapping involves factors like camera calibra
0 views • 21 slides
Geospatial Technology Services at University of Edinburgh
The University of Edinburgh, through its Information Services, specializes in developing and delivering projects involving geospatial technology. They offer the Digimap Service, providing online access to maps and geospatial data. The university subscribes to the Eduserv Chest Agreement for Esri pro
1 views • 29 slides
Interactive Plotting with ggplot and Shiny: Enhancing Galaxy Visualization Tools
Explore the concept of transforming existing ggplot2 Galaxy tools into interactive platforms using Shiny or Plotly implementations. Discover a variety of plot types available with ggplot2, such as barplots, violin plots, PCA plots, and heatmaps. Utilize additional plot options through various geom_*
3 views • 9 slides
International Hydrographic Organization Report Summary
The report highlights the activities and achievements of the NATO Geospatial Maritime Working Group (GMWG) in 2018/19, focusing on providing maritime geospatial standards, governance, production support, and operational information. It discusses the progress and key outcomes of the NATO AML Co-Produ
0 views • 13 slides
National Geospatial Information Management Strategy Action Plan Update
The National Geospatial Information Management Strategy Action Plan Update outlines five strategic goals focusing on governance, data, access, interoperability, and development. Under each goal, multiple action points are detailed, including reviewing council roles, updating legislation, coordinatin
4 views • 13 slides
Empowering Women in Geospatial Information: A Look at Fiji and the Pacific
Explore the impactful role of women in geospatial information management in Fiji and the Pacific region through the leadership, achievements, and future prospects highlighted in the article. From Meizyanne Hicks leading the way to the significant contributions by women in the geospatial industry, th
0 views • 6 slides
EEG Conformer: Convolutional Transformer for EEG Decoding and Visualization
This study introduces the EEG Conformer, a Convolutional Transformer model designed for EEG decoding and visualization. The research presents a cutting-edge approach in neural systems and rehabilitation engineering, offering advancements in EEG analysis techniques. By combining convolutional neural
1 views • 6 slides
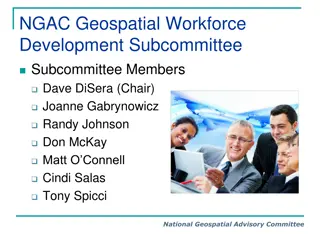
NGAC Geospatial Workforce Development Subcommittee Activities Overview
The NGAC Geospatial Workforce Development Subcommittee's purpose is to provide recommendations for developing a skilled geospatial workforce. The subcommittee members are actively involved in various activities such as examining STEM education synergies, reviewing federal job classification codes, a
0 views • 12 slides
Geospatial Database Development for KRISHI Portal: Nodal Officers Workshop
Geospatial databases play a crucial role in providing location-specific agricultural services through the KRISHI Portal. This workshop focuses on the core objective of the portal, simple GeoPortal architecture, main services offered, the significance of geospatial data, and the utilization of spatia
0 views • 45 slides
Evolution of Geospatial Governance in the United States
Geospatial governance in the United States has evolved over the years, with key milestones such as the establishment of the Geographic Board, the National Spatial Data Infrastructure, and the role of Federal agencies in surveying and mapping activities. Significant reports have highlighted the need
1 views • 11 slides
Design and Evaluation in Visualization Techniques
Understanding the importance of formal evaluations in visualization techniques, this material covers a range of evaluation methods including empirical and analytic approaches such as usability tests, controlled experiments, and expert reviews. It delves into the scientific method of hypothesis forma
1 views • 41 slides
Geospatial Portfolio Management and NGDA Themes Overview
Explore the roles and responsibilities of Theme Leads, Dataset Managers, and the Investment Collaboration Process in Geospatial Portfolio Management. Understand the significance of National Geospatial Data Assets (NGDA) Themes, Theme Lead Agency roles, and the proposed NGDA Themes for effective port
0 views • 17 slides
UN-GGIM Private Sector Network: Enhancing Global Geospatial Initiatives
The UN-GGIM Private Sector Network (PSN) serves as a platform for private sector collaboration with Member States on geospatial initiatives. The PSN aims to enhance the world's geospatial capabilities, support policy development, and address global challenges. It operates independently while alignin
0 views • 17 slides
Geospatial Private Sector in Africa: Opportunities and Challenges
The geospatial private sector in Africa faces challenges due to its small and disjointed nature, with a focus mainly on multinational corporations. Initiatives like UN-GGIM are encouraging private sector participation at national and continental levels. Efforts are being made to include the private
0 views • 6 slides
Geospatial and Statistical Data Integration in Rwanda: A Closer Look at RCMRD's Role
Explore the evolution of geospatial and statistical data integration in Rwanda, focusing on the initiatives led by Dr. Emmanuel Nkurunziza, General Director of RCMRD. Discover how advancements in geospatial technologies and statistical systems are shaping sustainable development in the region.
0 views • 14 slides
Cloud-based Geospatial Query Processing Using MapReduce and Voronoi Diagrams
This research paper presents a cloud-based approach for processing geospatial queries efficiently using MapReduce and Voronoi diagrams. The motivation behind the study, related works in the field, preliminary concepts of MapReduce, Voronoi diagram creation, query types, performance evaluation, and f
0 views • 30 slides
Multidimensional Icons in Data Visualization Solutions
This collection showcases various types of visual icons used in data visualization to represent values of different variables, such as categorical, quantitative, and Boolean data. Each icon summarizes specific information for a given item in a collection, ranging from nominal and ordinal data to the
0 views • 9 slides
Geospatial Visualization of Fiscal Data at Arizona BLM
Enhancing operational excellence at the Bureau of Land Management (BLM) through geospatial methods to connect budget allocations and spending with field offices in Arizona. Utilizing GIS tools, data spatially represents budget planning, workload execution, and resource distribution for informed deci
0 views • 25 slides
Recent Developments in Marine Geospatial Information Management
The Baltic Sea Hydrographic Commission and related activities highlight significant developments in marine geospatial information management, including upcoming council meetings, GEBCO initiatives, and UN-GGIM endorsements of integrated marine geospatial frameworks. These efforts aim to enhance data
4 views • 8 slides
Enhancing Safety in Navigation Through Improved Data Quality Visualization
The IHO Data Quality Working Group focuses on classifying and depicting the quality of digital hydrographic information to ensure safe navigation. The group addresses the need for clear warnings on ECDIS displays regarding poor-quality survey data. Despite progress in developing visualization method
1 views • 34 slides
Software Design Patterns for Information Visualization
Explore design patterns for information visualization interfaces, understand the complexities, and leverage tools like Google API. Learn about different software design patterns, categories of patterns for information visualization, and the relationships between them. Discover the reference model fo
0 views • 27 slides
Development of UN-IGIF Action Plan in Cameroon: Addressing Geospatial Data Governance Challenges
The journey of developing a UN-IGIF Action Plan at the country level in Cameroon begins with identifying stakeholders and common strategic priorities, mobilizing support, setting up project teams, drafting action plans, and organizing workshops. The lack of coordination among geospatial information
0 views • 4 slides
Interactive Data Visualization Tools and Techniques Quiz
This quiz tests knowledge on data visualization tools, techniques, and concepts. Questions cover topics such as the use of EDA in data visualization, interactive graph outputs, historical figures in data visualization, GIS data types in SAS/JMP, outlier detection in 3D scatterplots, and limitations
1 views • 11 slides
Cognition Models in InfoVis: Understanding Knowledge Creation Process
Visualization plays a key role in aiding cognition by supporting knowledge creation and seeking tasks through process models and task taxonomies. Understanding the cognitive aspects of information visualization is crucial for aiding comprehension and knowledge understanding, as demonstrated by the u
0 views • 41 slides
Northern Utah GIS Workforce Survey 2014 Results Overview
The Northern Utah GIS Workforce Needs Survey Results for 2014 provide insights into the demographics, industry experience, survey respondents by county in Utah, and educational requirements for GIS/geospatial technicians. The survey highlights the distribution of position titles, length of experienc
1 views • 26 slides
Enhancing Classmate's Data Visualization for Homework Assignment 2
Explore the process of applying a classmate's data visualization code to your own data for Homework Assignment 2. Critique the effectiveness of the visualization in conveying the intended point and offer suggestions for improvement if necessary. Follow the steps outlined to submit your completed ass
0 views • 4 slides
Recent Developments in Geospatial Information Management in the Asia-Pacific Region
Key events include the Executive Board Meeting in Singapore, the 11th Plenary Meeting in India, Fourth Ministerial Conference on Space Applications in Indonesia, workshops on geospatial information sharing, and UN-GGIM-AP's contribution to the global geodesy agenda. Activities such as elections, wor
0 views • 9 slides
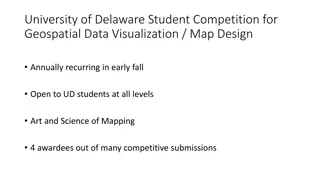
University of Delaware Student Competition for Geospatial Data Visualization
Annual student competition at University of Delaware for geospatial data visualization and map design, open to students at all levels. Winner of 2021: Loonibha Manandhar, with honorable mentions to Anthony Chan, Matthew Hardy, and James Blount. A platform for showcasing the art and science of mappin
0 views • 4 slides
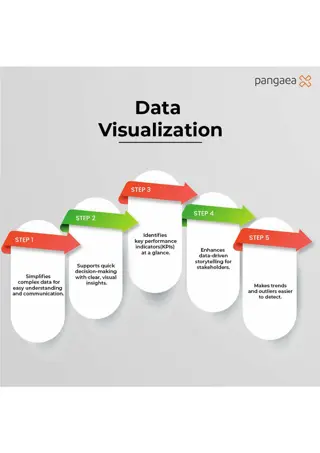
Maximize Business Impact with Data Visualization
This infographic shows how data visualization simplifies complex data, supports decision-making, highlights KPIs, and enhances data-driven storytelling. Its an essential tool for identifying trends and outliers. Discover expert data visualization talent at Pangaea X by visiting www.pangaeax.com.
7 views • 1 slides
Data Visualization Presentations Collection
Collection of various image slides containing charts, graphs, and data visualization elements. The slides showcase different types of visual representations such as bar graphs, line charts, percentages, and more. Each slide provides a unique visualization, making it a diverse collection for presenta
0 views • 13 slides
Effective Stakeholder Interviews for Visualization Tool Improvement
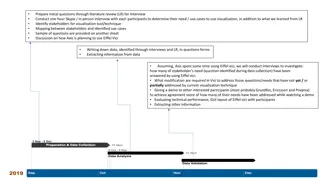
Conducting in-depth interviews with stakeholders is crucial for identifying their needs and use cases for visualization tools. By asking targeted questions and analyzing responses, insights can be gained to enhance the current visualization technique, like Eiffel Vici. The process involves mapping s
0 views • 5 slides
Assessment of Geospatial Data Readiness for SDG Monitoring in African Countries
Quick assessment conducted during the workshop in Addis Ababa, Ethiopia, revealed the utilization of geospatial data for national and regional planning among African countries. Findings indicate the availability of fundamental geospatial datasets, highlighting the importance of incorporating geoinfo
0 views • 18 slides
Importance of Data Visualization in Network Management
Data visualization plays a crucial role in understanding and extracting value from data, especially in the realm of network management. Visualization techniques enable better decision-making, pattern recognition, and storytelling with data. By exploring data through visualization tools, one can unco
0 views • 26 slides
