Geospatial Visualization of Fiscal Data at Arizona BLM
Enhancing operational excellence at the Bureau of Land Management (BLM) through geospatial methods to connect budget allocations and spending with field offices in Arizona. Utilizing GIS tools, data spatially represents budget planning, workload execution, and resource distribution for informed decision-making.
Uploaded on Sep 17, 2024 | 5 Views
Download Presentation

Please find below an Image/Link to download the presentation.
The content on the website is provided AS IS for your information and personal use only. It may not be sold, licensed, or shared on other websites without obtaining consent from the author.If you encounter any issues during the download, it is possible that the publisher has removed the file from their server.
You are allowed to download the files provided on this website for personal or commercial use, subject to the condition that they are used lawfully. All files are the property of their respective owners.
The content on the website is provided AS IS for your information and personal use only. It may not be sold, licensed, or shared on other websites without obtaining consent from the author.
E N D
Presentation Transcript
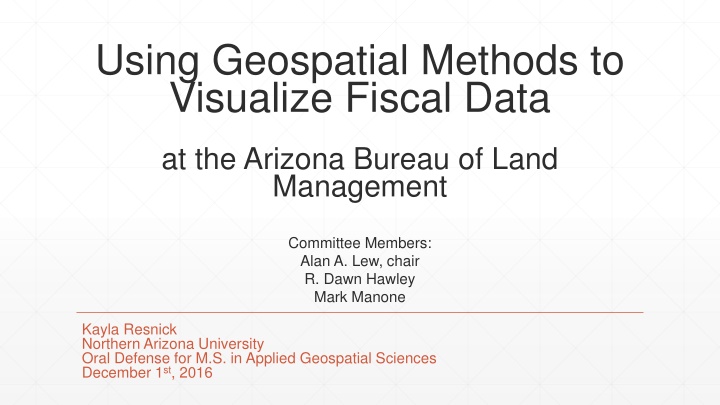
Using Geospatial Methods to Visualize Fiscal Data at the Arizona Bureau of Land Management Committee Members: Alan A. Lew, chair R. Dawn Hawley Mark Manone Kayla Resnick Northern Arizona University Oral Defense for M.S. in Applied Geospatial Sciences December 1st, 2016
Practicum Objective The intent of this practicum is to aid the Bureau of Land Management (BLM) in obtaining operational excellence and achieving their strategic goals by spatially connecting on the ground accomplishments to budget and fiscal data. The result is a visual representation of budget allocations and spending, connected geospatially to Arizona BLM Field Offices across the state.
Background The BLM is a federal agency tasked with sustaining the health, diversity, and productivity of America s public lands (BLM.gov 2012) They use their operating budget of over $1 billion to regulate activities such as grazing, recreation, timber use, commercial leases, and energy development The duties of the BLM are carried out across the United States by a hierarchy of Federal, Regional, State, District, and Field offices. Within Arizona, there is one state office, four district offices, and eight field offices.
Research Questions and Outcome Questions Outcome 1) How well are we planning and executing our workload? Results can be viewed by management to make budget decisions, visualize spending, and understand patterns. 2) How well are we planning and executing our budget?
Literature Review 1) History and Importance of Visual Data Maps as vehicles Maps for non-spatial data 2) GIS use in Government Offices Resource distribution Doing more with less 3) BLM GIS Management Guiding documents
Data Spatial: ArcMap Fiscal: Excel Boundary files such as state, district, and field offices 2 budget tables Master Budget for budget questions 2015PMDS for workload Also wilderness and conservation areas, national monuments Retrieved from BLM Budget Tool or BLM Budget Officers. UTM NAD 1983 Zone 12N Retrieved from BLM.gov GIS library
Data 1) Performance Management Data Systems (PMDS) Workload tracking method with multiple units of measurement including acres, projects, buildings, evaluations, agreements, permits, and sites 2) Financial & Business Management System (FBMS) Budget, procurement, obligations, and expenses 3) Program Elements (PE) 2 digit tracking codes tied to PMDS to measure workload 4) Budget Object Codes (BOC) Type of spending category, demonstrates labor and operations budget costs
Fund Center LLAZ9xxxxx LLAZA00000 LLAZA01000 LLAZA02000 LLAZA03000 LLAZC00000 LLAZC01000 LLAZC02000 LLAZC03000 LLAZG00000 LLAZG01000 LLAZG01100 LLAZG02000 LLAZG02100 LLAZG02200 LLAZG03000 LLAZP00000 LLAZP01000 LLAZP02000 LLAZP03000 LLAZP04000 Name State Office Arizona Strip District Office Arizona Strip Field Office Vermilion Cliffs National Monument Grand Canyon National Monument Colorado River District Office Kingman Field Office Yuma Field Office Lake Havasu Field Office Gila District Office Safford Field Office Gila Box Riparian NCA Tucson Field Office Las Cienegas NCA San Pedro Riparian NCA Ironwood Forest National Monument Phoenix District Office Hassayampa Field Office Lower Sonoran Field Office Agua Fria National Monument Sonoran Desert National Monument Longitude -116.18700000 -113.14700000 -112.80400000 -111.84000000 -113.63900000 -113.71400000 -113.78500000 -114.03200000 -114.03500000 -110.12200000 -109.86100000 -109.43700000 -110.78600000 -110.56400000 -110.16700000 -111.44300000 -111.94300000 -111.15600000 -112.46700000 -112.05200000 -112.42200000 Latitude 33.55100000 36.60000000 36.65900000 36.84900000 36.23700000 34.16200000 35.15400000 32.97900000 34.14400000 33.13000000 33.67300000 32.93300000 31.96700000 31.89200000 31.36200000 32.45500000 33.13000000 35.46400000 32.66400000 34.22200000 32.90900000 Methodology Assign a Cartesian coordinate to the center of each field office Add data Display XY Data Result: stacked points Export to feature class Summarized spatial join
How well are we planning and executing our workload? This data examines PMDS target and actual achievements per Field Office. Overall PMDS achieved at state, district, and field office level PMDS achieved per specific program element BH Inventory abandoned mine lands (sites) FH Process and manage special recreation permits (permits) EE Issue grazing permits/leases (permits) JA Apply shrub/grass vegetation (acres)
Case Study: Tucson The Tucson Field Office accomplished 126,429/263,311 workload measures, equal to 48%. This value is most affected by Evaluating Recreation Areas (MA) Program Element, particularly within the National Monument and Conservation Areas. This Program Element is measured in acres, and Tucson fell far short of its target. This figure was also influenced by acres evaluated for Invasive and Noxious Weeds, where Tucson evaluated 0 of its target 42,280 acres.
How well are we Planning and executing our Budget? This section examines three categories of data. FBMS spending per field office by sub-activity 1020 Rangeland Management 1210 Wilderness Management 1220 Recreation Management 1711 National Monument and Conservation Areas Direct and Indirect costs by PE Indirect costs: P, X, Y Direct costs: all others Budget Object Codes for labor and operations Labor: 11 & 12 Operations: all others
FMBS Spent per Sub-activity 1020 Rangeland Management 1210 Wilderness Management
FMBS Spent per Sub-activity 1711 National Monuments & Conservation Areas 1220 Recreation Management
Spending per Field Office Direct Indirect
BOC Labor and Operations Labor Operations
Conclusions The results produced for this practicum are intended to represent data accurately, illustrate patterns, and raise questions. Results demonstrate that the BLM is planning and executing their budget and workload effectively. Areas of possible concern are highlighted, allowing for further exploration. Field office economic data can be compared across the state in multiple spending categories. Results are most beneficial for those familiar with BLM procedures
Reflection Practicum objective accomplished Practicum agency: Practicum provides an opportunity to spot potential budget issues, determine their true cause, and track changes over time. Personal: Practicum provided useful and tangible deliverables for the agency and allowed me to demonstrate technical skills acquired through coursework. Most useful as a methodology and framework Opportunities for future work
Thank you Kayla Resnick Northern Arizona University
