
Compliance Solutions: Zigram Data's Global Sanctions Screening Platforms
Zigram Data offers comprehensive compliance solutions with its Global Sanctions Screening platforms, empowering organizations to meet regulatory obligations effectively. Our platforms utilize advanced technology and data analytics to streamline the screening process and minimize false positives, ena
6 views • 1 slides
Do REST APIs Transform Marketing Dashboards for Better Data Flow_
Could REST APIs be the key to unlocking faster, more efficient data analysis in your marketing efforts? Explore the potential for rapid query generation and streamlined insights, transforming the way you leverage data for decision-making. Discover the potential of marketing dashboards and how they s
4 views • 6 slides
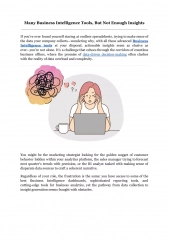
Many Business Intelligence Tools, But Not Enough Insights
Discover the paradox of having many Business Intelligence Tools, but not enough insights in our latest article. Uncover the reasons behind the Insight Gap in businesses and learn effective strategies to harness the full potential of your data. Find out how to select the best Business Intelligence da
4 views • 5 slides

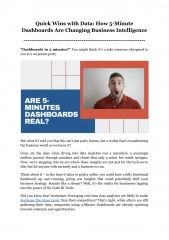
Quick Wins with Data_ How 5-Minute Dashboards Are Changing Business Intelligence
Unlock the power of Quick Wins with your data: Explore how 5-Minute Dashboards are revolutionizing Business Intelligence. Say goodbye to the frustrations of slow, complex analytics processes and welcome a new era where actionable insights are just minutes away with No-Code BI Tools. Transform decisi
1 views • 4 slides
Quick Wins with Data_ How 5-Minute Dashboards Are Changing Business Intelligence
Unlock the power of Quick Wins with your data: Explore how 5-Minute Dashboards are revolutionizing Business Intelligence.
4 views • 4 slides
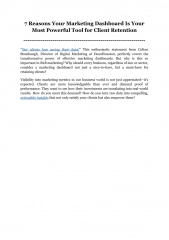
7 Reasons Your Marketing Dashboard Is Your Most Powerful Tool for Client Retention
Uncover the secrets to exceeding client expectations and fostering long-term success with the strategic use of Business Intelligence dashboards.
0 views • 5 slides

Why Most Data Visualization Dashboards Fail — And How to Make Yours Succeed
Embrace the opportunity to see how Grow can transform your business data visualization strategy with a 14-day free trial.
2 views • 4 slides

Introduction to IBM Watson Explorer in Business Intelligence: University of Rome La Sapienza Course
The course at University of Rome La Sapienza introduces students to IBM Watson Explorer for Business Intelligence. It covers practical use cases, advanced BI topics, and familiarization with real software used in organizations. The schedule includes sessions on Watson Explorer features, conducting B
0 views • 34 slides

Oregon Legislative Session Highlights 2023
The 2023 Oregon legislative session saw various bills passed, including measures related to opioids, marijuana, alcohol shipment, and youth education. Notable bills include HB 2395 focusing on opioid access and harm reduction, HB 2516 enabling direct sales of marijuana items, SB 616 allowing cider a
0 views • 9 slides

U.S. Geological Survey Flood Capabilities.
Explore the U.S. Geological Survey's flood capabilities in Connecticut, including real-time streamflow data, precipitation monitoring, groundwater levels, and more. Access tools for flood documentation, peakflow analysis, and national water monitoring through interactive dashboards. Stay informed an
3 views • 19 slides

Comprehensive Guide to Accessing and Utilizing Indicator Toolkits
This detailed guide covers various aspects of using Indicator Toolkits, including locating toolkits, completing required activities, uploading documentation, accessing dates to remember, and utilizing compliance monitoring dashboards. Learn how to efficiently navigate through the toolkits for compli
5 views • 26 slides
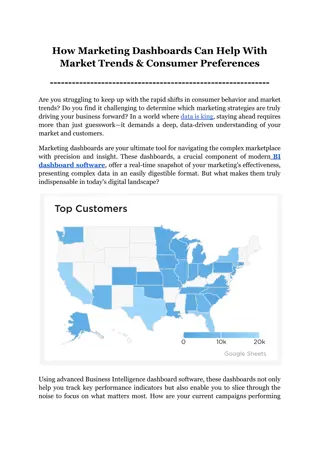
How Marketing Dashboards Can Help With Market Trends & Consumer Preferences
Dive into the capabilities of marketing dashboards and discover the secrets to staying ahead in a competitive market.
2 views • 5 slides
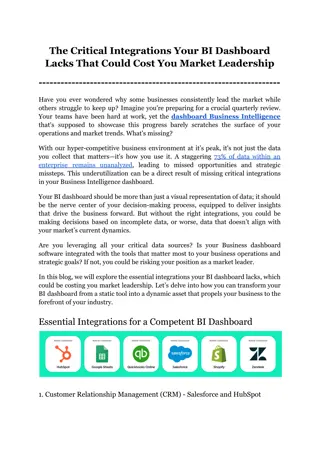
The Critical Integrations Your BI Dashboard Lacks That Could Cost You Market Leadership
Discover the vital integrations your Business Intelligence(BI) dashboard requires to secure and enhance your competitive advantage in the market. This blog provides an in-depth examination of the critical integrations that many Business Intelligence dashboards lack, which could be detrimentally impa
2 views • 5 slides

BI Platforms Fail to Empower Non-Technical Users — Here’s How to Change That
Most Business Intelligence platforms fall short in empowering non-technical users due to overwhelming complexity and technical jargon. Learn practical strategies to transform your BI solution into a working BI platform that simplifies data access and enables every team member to make data-driven dec
3 views • 6 slides

Don’t Confuse More Data with Better Insights — How to Streamline Your Marketing Dashboards
In today's data-driven world, more data doesn't always mean better insights. Learn how to streamline your marketing dashboards by focusing on core KPIs, ensuring data accuracy, and adopting a user-centric design. Discover practical tips for prioritizing metrics, implementing hierarchical layouts, an
3 views • 8 slides
How Customizable Dashboards Can Save Thousands of Hours in Data Analysis Across Multiple Teams
Discover how customizable dashboards can dramatically streamline your data analysis process across multiple teams, saving thousands of hours and enhancing decision-making. Here you explores the transformative power of BI dashboard tools like Grow, which enable real-time data access and personalized
2 views • 5 slides
This Is How You Adjust KPI Metrics in Real-Time for Maximum Impact
Discover how to stay ahead in today's fast-paced business environment by adjusting KPI metrics in real-time. This blog outlines practical steps for identifying critical KPIs, setting up real-time data feeds, implementing automated alerts, and making informed decisions using SMART KPIs and KPI dashbo
1 views • 5 slides
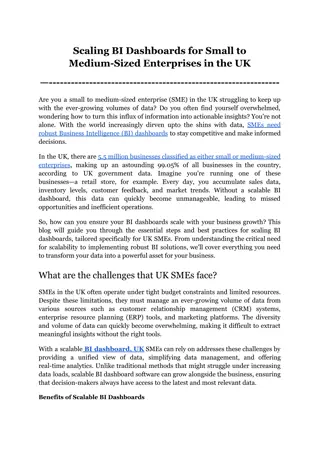
Scaling BI Dashboards for Small to Medium-Sized Enterprises in the UK
Scaling BI dashboards is crucial for small to medium-sized enterprises (SMEs) in the UK to effectively manage their growing data needs. This blog delves into the unique challenges and best practices for implementing scalable Business Intelligence (BI) solutions.
1 views • 6 slides
Why Customization Is the Key to Powerful Marketing Dashboards
Discover why customization is essential for creating powerful marketing dashboards. Learn how tailored dashboards can lower acquisition costs, improve revenues, and enhance marketing efficiency.\n\nThis explores the specific features and benefits of a customized marketing reporting dashboard, suppor
1 views • 8 slides
Old vs. New in Business Intelligence Data Visualization_ What Really Has Changed_
Discover how business intelligence data visualization has transformed from static reports to dynamic, interactive dashboards. Explore the technological advancements, such as AI, real-time data integration, and no-code tools, that have revolutionized how businesses harness and visualize their data.
0 views • 8 slides

Unveiling the Secrets of Subscription Growth and Retention Strategies
Delve into the strategies behind subscription growth and retention, as outlined through a visual journey. Explore the historical success stories, retention rate focuses, standard subscription dashboards, customer acquisition costs, and more. Discover methods to overcome growth stalls and sustain a t
2 views • 39 slides
_How to Achieve an Overall View by Relying on BI Dashboards (Instead of Multiple Platforms)
Are you struggling with fragmented data and inconsistent reports across multiple platforms? Discover how transitioning to a unified Business Intelligence (BI) dashboard can transform your data strategy. In this blog, we explore the benefits of BI das
0 views • 7 slides

Urban Surveillance and Health Reporting System in Bangalore Model
Urban surveillance under the Integrated Disease Surveillance Program (IDSP) in Bangalore, Karnataka, involves monitoring health facilities, online reporting of diseases, and coordinated response actions. The system includes reporting from hospitals and labs, real-time alerts, and tracking preventive
0 views • 7 slides

Enhancing the Degree Works Experience with the Responsive Dashboard
The Degree Works Responsive Dashboard by Ellucian introduces a modernized tool for students and advisors, offering a mobile-friendly interface, intuitive plan building features, and support for both classic and responsive dashboards. Key components such as student search, advanced search, student he
0 views • 21 slides
How Custom REST APIs Can Solve Your Biggest Data Challenges (And Streamline Reporting)
With dynamic BI reports and dashboards, Grow is a state-of-the-art BI reporting solution that offers insights that can be used. Grow ensures your BI reporting is accurate and up to date by integrating seamlessly with over 100 data connectors, includi
0 views • 6 slides

Personal Development Planning and Reflection Tools
Explore alternative life plans through Odyssey Planning Worksheets and Life Dashboards. Evaluate current goals, consider backup options, and assess resources, confidence, coherence, and likability. Visual aids and structured questions help you navigate potential paths and align with lifestyle and pu
0 views • 4 slides

Workday Reporting Strategy and Implementation at WSU
Workday Reporting at WSU involves a comprehensive strategy for developing and utilizing reporting tools, dashboards, and data warehouse solutions. The approach includes immediate post-launch initiatives with over 350 custom reports, ongoing refinement processes, and exploration of new data warehousi
0 views • 33 slides
Community Engagement Tracking Tool for HIV Care Advocacy
Empowering communities affected by HIV, the Community Engagement Tracking Tool facilitates meaningful engagement in decision-making for access to quality care. Developed by the Community Advocacy Network, it enhances collaboration between policymakers, program implementers, and communities to improv
0 views • 9 slides
OCHA Assessment, Planning and Monitoring Branch Overview
OCHA's Assessment, Planning and Monitoring Branch (APMB) collaborates with field offices in Nigeria, CAR, and Afghanistan to develop tools using Microsoft Power apps for real-time data analysis. The branch provides platforms like the Planning Bridge Tool to integrate partner projects with cluster pr
2 views • 26 slides
Helical Insight a Powerful Alternative to Tableau
In the realm of business intelligence (BI) and data visualization, Tableau has long been a leading choice for organizations seeking advanced analytics and interactive dashboards. However, as businesses grow and evolve, so too do their needs for more
0 views • 2 slides
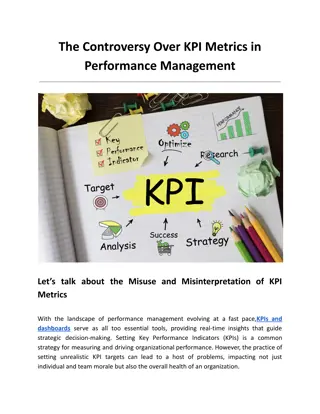
The Controversy Over KPI Metrics in Performance Management
Are KPI metrics the ultimate tools for performance management, or do they sometimes lead businesses astray? Our latest blog dives deep into the complexities of KPI metrics and dashboards, highlighting how their misuse and over-reliance can distort bu
1 views • 8 slides
O3 Access Control Solution Overview
O3 Access Control Solution offers unique selling points like single-seat management software, role-based permissions, customizable user information, and more. The system includes a compact controller with multi-format reader support and BACnet Access objects. It integrates with other O3 modules for
0 views • 10 slides
USDA CXO Dashboards for Data-Driven Decision-Making
This document outlines the progress and plans for implementing CXO Dashboards within the USDA to enable data-driven decisions. It covers the purpose, accomplishments, current status, timeline, and risk assessment of the project. Key highlights include the development of executive and OCIO dashboards
0 views • 9 slides
7 Indicators That Your BI Reporting Is Top Notch
Is your BI reporting truly delivering the insights you need? In this blog, we explore the seven key indicators that signal top-notch BI reporting. From data accuracy and user-friendly dashboards to actionable insights and robust security, learn how t
0 views • 9 slides
Why the Best BI Dashboards Might Not Be Right for Your Small Business
Explore why top-tier BI dashboards, though feature-rich, might not be the best fit for your small business. This article delves into the challenges and costs that come with sophisticated BI tools and highlights practical alternatives that align bette
1 views • 9 slides
Key Performance Indicators (KPIs) and Dashboards for Improved Performance
Key Performance Indicators (KPIs) play a vital role in assessing organizational performance across various areas. This content emphasizes the importance of measuring outcomes, monitoring uptime and downtime, and examples of KPIs in equipment management. It also provides insights on creating KPI dash
1 views • 11 slides

Using Cloud Computing to Scale Marketing Reporting Dashboards Across Enterprises
Discover how cloud computing is revolutionizing enterprise marketing by elevating the power and reach of the marketing reporting dashboards. This insightful blog explores the seamless integration of scalable cloud technologies to enhance data accessi
1 views • 7 slides

Enhancing Dashboard Creativity and Widget Usage for Effective Data Management
Explore the world of creative dashboards and worthwhile widgets in this session led by Shelly Rheinfrank. Learn how to change existing dashboards, add new ones, use and create widgets, and deploy navigation tips and tricks. Discover the art of customizing dashboards, adding new dashboards with a spe
0 views • 19 slides
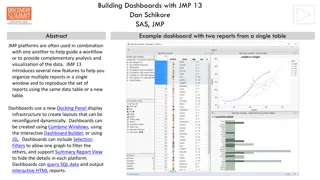
Building Dashboards with JMP 13: Organizing and Reproducing Reports Dynamically
JMP 13 introduces new features for creating interactive dashboards with multiple reports using Docking Panels for reconfigurable layouts. Dashboards can be customized using Combine Windows, Dashboard Builder, or JSL, allowing for dynamic organization and visualization of data. Learn how to maximize
1 views • 9 slides
PearsonAccess Next Dashboards
Navigate through PearsonAccess Next Dashboards to access valuable information and insights. Learn about the roles and access rights, how to access the dashboards, view session and test statuses, and make the most out of the Dashboard Home Page.
0 views • 18 slides