Understanding Data Types and Summary Statistics in Exploratory Data Analysis
Data types, including discrete numerical, continuous numerical, ordinal, and nominal, are essential in exploratory data analysis. Variables can be categorized based on their nature, such as numerical variables (interval vs. ratio) and categorical data summaries. Learn about USGS flow measurements, n
4 views • 48 slides
Understanding Inference Tests and Chi-Square Analysis
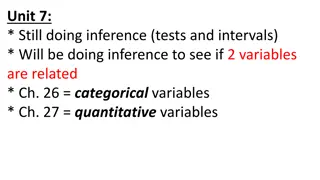
The content discusses the application of inference tests to determine if two variables are related, focusing on categorical and quantitative variables. It provides examples related to testing fairness of a die and comparing observed and expected distributions of Skittles colors. Additionally, it cov
1 views • 16 slides
Overview of Categorical Aid in Education Finance
Categorical aid in education funding serves specific purposes such as special education, transportation, and mental health. It operates outside revenue limits and often comes in fixed or prorated amounts. The process involves targeted grants and reimbursement formulas. Special Education & School-Age
1 views • 36 slides
Ask On Data for Efficient Data Wrangling in Data Engineering
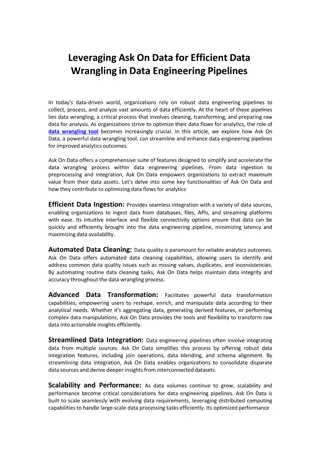
In today's data-driven world, organizations rely on robust data engineering pipelines to collect, process, and analyze vast amounts of data efficiently. At the heart of these pipelines lies data wrangling, a critical process that involves cleaning, transforming, and preparing raw data for analysis.
2 views • 2 slides
Understanding Exploratory Data Analysis (EDA) for Effective Data Insights
Exploratory Data Analysis (EDA) is a crucial approach for analyzing data by utilizing various techniques to extract insights, identify anomalies, and visualize trends. By leveraging EDA using tools like Pandas, researchers can improve their understanding of data variables, detect errors, and explore
2 views • 14 slides
Qualitative Data Analysis Techniques in Research
The purpose of data analysis is to organize, structure, and derive meaning from research data. Qualitative analysis involves insight, creativity, and hard work. Researchers play a crucial role as instruments for data analysis, exploring and reflecting on interview discussions. Steps include transcri
1 views • 27 slides
Graduate Level Categorical Data Analysis Course
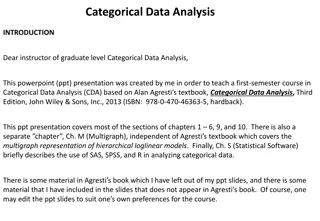
This PowerPoint presentation offers a comprehensive guide to teaching a first-semester course in Categorical Data Analysis at the graduate level. Covering key sections from Alan Agresti's textbook, the presentation includes real-data examples, software guidance, and solutions to exercises. The instr
1 views • 5 slides
Understanding Ordinal Regression in Data Analysis
Introduction to ordinal regression, a powerful tool for analyzing categorical variables with natural ordering. Explore cumulative odds, probabilities, and the proportional odds model. Learn about estimating equations, intercepts, and slopes in ordinal regression models. Discover how higher values of
1 views • 15 slides
Understanding Latent Transition Analysis: A Comprehensive Overview
Latent Transition Analysis (LTA) is a statistical method that identifies unobservable groups within a population using observed variables, aiding in profiling individuals and tracking transitions over time. It is particularly useful for modeling categorical constructs, informing prevention and inter
0 views • 23 slides
Understanding Categorical and Numerical Data in Mathematics
Explore the distinction between categorical and numerical data in math. Learn how mathematicians categorize and analyze data, sorting cards into different categories to understand similarities and differences. Develop perseverance skills by determining survey question types and defining data types w
0 views • 9 slides
Statistical Analysis in Birth Season Distribution
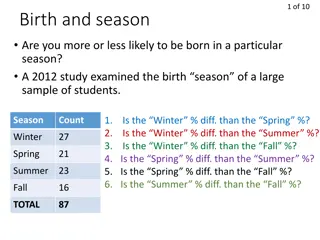
A statistical study examines birth season distribution among students, comparing the number of births in different seasons. Chi-Square tests are utilized to analyze the data and test for associations between categorical variables. An example uses the goodness-of-fit test to determine if student grad
0 views • 10 slides
Analyzing Relationships Between Categorical Variables in Statistics
Explore relationships between two categorical variables in statistics, distinguishing between explanatory and response variables. Learn to create segmented bar charts and identify associations. Understand the importance of identifying explanatory variables in analyzing data relationships. Improve yo
0 views • 15 slides
Parallel Chi-square Test for Feature Selection in Categorical Data
The chi-square test is a popular method for feature selection in categorical data with classification labels. By calculating chi-square values in parallel for all features simultaneously, this approach provides a more efficient solution compared to serial computation. The process involves creating c
1 views • 4 slides
Visualizing Categorical Data in Data Analysis
Explore methods for displaying and describing categorical data effectively, from frequency tables to bar and pie charts. Understand the importance of visual representation in drawing insights and making comparisons. Dive into examples using football team data and Titanic survivors. Learn to identify
1 views • 20 slides
Data Analysis and Passage Analysis Project Proposal
This project proposal by Anthony Yang focuses on developing a Java program for data analysis and passage analysis. The motivation behind the project is to gain more knowledge in computer science and statistics-related topics while utilizing technology to extract useful insights from data. The propos
0 views • 8 slides
Analysis of Categorical Data at Marada Inn and Pelican Stores
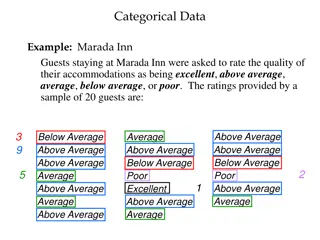
The analysis includes rating frequencies and relative frequencies for quality ratings at Marada Inn, as well as customer transaction data at Pelican Stores during a promotion. Graphs and tables summarize qualitative variables for evaluation and managerial reporting.
0 views • 28 slides
Analyzing Categorical Growth and Values Table in Accountability Panel
Analyze the growth and values table in the accountability panel through categorical growth and status improvement tables. The subgroups' significance of categorical status changes is assessed using a rating system. Temporary cut scores for sub-categories have been employed for evaluation, with a foc
0 views • 51 slides
Understanding Chi-Square Tests in Statistics
Chi-square tests in statistics are used to examine the relationship between categorical variables or test claims about categorical variable distributions in populations. The Chi-square test statistic measures the discrepancy between observed and expected counts, with the Chi-square distribution help
0 views • 16 slides
Parallel Implementations of Chi-Square Test for Feature Selection
The chi-square test is an effective method for feature selection with categorical data and classification labels. It helps rank features based on their chi-square values or p-values, indicating importance. Parallel processing techniques, such as GPU implementation in CUDA, can significantly speed up
0 views • 4 slides
Understanding Chi-Square Tests in Statistics
Explore the concept of Chi-Square tests through an illustrative example of testing preferences among artists. Learn about Goodness-of-Fit tests, hypotheses, expected versus observed frequencies, new test statistics, and interpreting results through p-values. Discover how these tests compare observed
0 views • 10 slides
Understanding Latent Class Analysis in Research
Latent Class Analysis (LCA) is a person-centered approach that categorizes individuals based on underlying differences. This method links observed behaviors to categorical variations, providing insights into groupings within data sets.
0 views • 23 slides
Understanding Binary Outcome Prediction Models in Data Science
Categorical data outcomes often involve binary decisions, such as re-election of a president or customer satisfaction. Prediction models like logistic regression and Bayes classifier are used to make accurate predictions based on categorical and numerical features. Regression models, both discrimina
0 views • 67 slides
Multidimensional Icons in Data Visualization Solutions
This collection showcases various types of visual icons used in data visualization to represent values of different variables, such as categorical, quantitative, and Boolean data. Each icon summarizes specific information for a given item in a collection, ranging from nominal and ordinal data to the
0 views • 9 slides
Understanding Categorical Data Analysis for Proportion Estimation
In the realm of categorical data analysis, estimating proportions is crucial for understanding population characteristics. This involves sampling, calculating sample proportions, standard errors, and constructing confidence intervals. Through examples like studying the effects of treatments on medic
0 views • 72 slides
Categorical Data Analysis in Population Studies
Inference methods for estimating proportions in a population are essential in categorical data analysis. This includes techniques for single proportions, confidence intervals, sample size determination, and Wilson-Agresti-Coull method for small sample sizes. Illustrated with examples and visuals, th
0 views • 80 slides
Understanding Classifiers in Data Analysis
In data analysis, classifiers play a crucial role in predicting categorical outcomes based on various features within the data. Through models and algorithms, classifiers can be used to make predictions about the future or infer present situations. Various classification methods and techniques are e
0 views • 50 slides
Understanding Different Types of Data in Statistics
Explore various types of data in statistics including discrete, categorical, bivariate, ordinal, and continuous data. Learn how to distinguish between these data types through examples and understand how they are used for data collection and analysis in different scenarios.
0 views • 8 slides
Introduction to IBM SPSS Modeler: Association Analysis and Market Basket Analysis
Understanding Association Analysis in IBM SPSS Modeler 14.2, also known as Affinity Analysis or Market Basket Analysis. Learn about identifying patterns in data without specific targets, exploring data mining in an unsupervised manner. Discover the uses of Association Rules, including insights into
0 views • 18 slides
Understanding Categorical Data Displays and Analysis
Visual displays of categorical data such as bar graphs, pie charts, and frequency distributions help organize and interpret large amounts of data effectively. Different types of graphs serve specific purposes, like comparing categories visually and identifying modes easily. This overview covers the
0 views • 10 slides
Statistical Analysis Practice Questions with Solutions
Practice various statistical analysis concepts including categorical and quantitative variables, mean calculations, distribution summaries, ogive interpretation, and data display techniques through a series of questions and images. Enhance your statistical knowledge and problem-solving skills with t
0 views • 20 slides
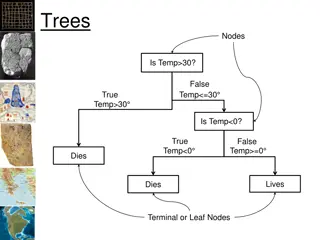
Understanding Classification and Regression Trees
Classification and Regression Trees are powerful tools used in data analysis to predict outcomes based on input variables. They are versatile, easy to interpret, and can handle both categorical and continuous predictors. Different types of trees, such as Regression Trees, Boosted Trees, and Random F
0 views • 16 slides
Understanding Car Market Trends through Interactive Data Analysis
Explore a practical example of gaining insights into the car marketplace by balancing criteria, analyzing competition, and market trends. Learn through tasks such as buying a car, selling an older model, and interpreting a categorical, ordinal, and numerical data table. Discover the significance of
0 views • 27 slides
Data Mining Course Project Overview: Pre-Processing to Classification
Explore the challenges and tasks involved in a data mining course project, from pre-processing to redefining classification tasks. The project involves handling a large dataset with numerous features, including numerical and categorical ones, addressing missing values, noisy data, and feature select
0 views • 33 slides
Understanding Latent Class Analysis: Estimation and Model Optimization
Latent Class Analysis (LCA) is a person-centered approach where individuals are assigned to different categories based on observed behaviors related to underlying categorical differences. The estimation problem in LCA involves estimating unobservable parameters using maximum likelihood approaches li
0 views • 30 slides
Understanding Venn Diagrams and Categorical Syllogisms
Venn diagrams, introduced by John Venn, visually represent relationships between different classes. Shading in diagrams signifies empty sets or no overlap between classes. Different types of categorical statements such as universal and particular are illustrated using examples. Explore how Venn diag
0 views • 30 slides
Understanding Categorical Syllogism in Logic: A Comprehensive Overview
Categorical syllogism, a form of inference with two premises and a conclusion, is a fundamental concept in logic. This type of deductive argument consists of three categorical propositions - universal affirmative, universal negative, particular affirmative, and particular negative. Terms such as maj
0 views • 16 slides
Understanding the Trade-off between Data Utility and Disclosure Risk
This study explores the balance between data utility and disclosure risk using a GA synthetic data generator. The authors delve into measuring utility and risk, emphasizing structured categorical data. They define synthetic data, discuss utility assessment methods, and outline how to measure data ut
0 views • 30 slides
Displaying Categorical Data: Bar and Pie Charts
This lesson explores the visual representation of categorical data using bar and pie charts. Learn how to create and interpret these graphs to display variable distributions clearly. Understand deceptive graph practices and master the skills to make accurate and informative data displays in Statisti
0 views • 16 slides
Effective Communication through Statistical Analysis
Descriptive statistics play a crucial role in understanding and communicating data effectively. Learn how to structure and present data through clear and accurate tables and diagrams. Make informed choices on choosing tables and diagrams based on whether the data is numerical scores or nominal data.
0 views • 26 slides
Advanced Concepts in Association Analysis: Handling Categorical Attributes
Explore advanced concepts in association analysis, focusing on the handling of categorical attributes. Learn how to apply association analysis to non-asymmetric binary variables, including examples and potential solutions for skewed attribute value distributions. Discover techniques for managing att
0 views • 48 slides

