Understanding Chi-Square Tests in Statistics
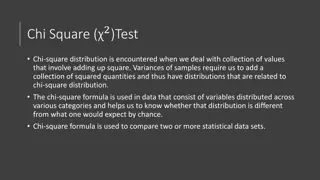
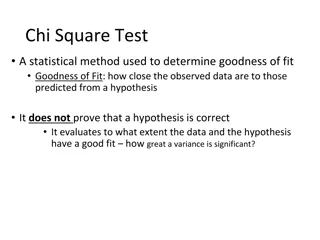
Explore the concept of Chi-Square tests through an illustrative example of testing preferences among artists. Learn about Goodness-of-Fit tests, hypotheses, expected versus observed frequencies, new test statistics, and interpreting results through p-values. Discover how these tests compare observed data to theoretical distributions in categorical data analysis.
Download Presentation

Please find below an Image/Link to download the presentation.
The content on the website is provided AS IS for your information and personal use only. It may not be sold, licensed, or shared on other websites without obtaining consent from the author. Download presentation by click this link. If you encounter any issues during the download, it is possible that the publisher has removed the file from their server.
E N D
Presentation Transcript
Chi-Square Tests Categorical data 1-sample, compared to theoretical distribution Goodness-of-Fit Test 2+ samples, 2+ levels of response variable Chi-square Test Slide #1 Chi-Square Tests
Goodness-of-Fit Test Compare observed to theoretical frequencies of individuals in categories. Examples Test whether responses are random (e.g., preference) Test Mendelian genetics (e.g., 3:1 and 9:3:3:1 theories). Test use of available resources (e.g., compare habitat usage to availability). Slide #2 Chi-Square Tests
An Illustrative Example Determine, at the 10% level, if Northland students prefer the Chris Duarte Group (CDG), Ronnie Baker Brooks (RBB), or Bernard Allison (BA). Hypotheses? Ha: different # of students prefer each artist Ho: same # of students prefer each artist Slide #3 Chi-Square Tests
An Illustrative Example 1/3 Under Ho, what proportion prefer each artist? If n=78, how many students prefer each artist if Ho is true? 26 Artist CDG RBB BA Expected Table Freq 26 26 26 Slide #4 Chi-Square Tests
An Illustrative Example Suppose these results were obtained: Artist CDG RBB BA Observed Table Freq 24 38 16 Is there a preference i.e., are these observations significantly different from what was expected when assuming no preference? Slide #5 Chi-Square Tests
A New Test Statistic ( ) 2 ected observed exp ected table = 2 exp df = cells - 1 Slide #6 Chi-Square Tests
An Illustrative Example Artist CDG RBB BA Observed Table # 24 38 16 Artist CDG RBB BA Expected Table # 26 26 26 ( ) ( )+ ( )+ 2 2 2 26 26 16 26 24 26 38 26 2 = 26 2 = 0.15 + 5.54 + 3.85 = 9.54 df = (3-1) = 2 p-value = 0.00848 Conclusion? Slide #7 Chi-Square Tests
Goodness-of-Fit Test Ho: distribution of individuals into levels follows the theoretical distribution HA: distribution of individuals into levels does NOT follow the theoretical distribution Sample: randomized, single variable of size n Assume: at least 5 in each cell of expected table Statistic: Observed frequency table Slide #8 Chi-Square Tests
Goodness-of-Fit Test ( ) 2 ected observed exp ected table Test Statistic: = 2 exp df: cells-1 ( ) p p 1 *z p Confidence Region: n where is sample proportion in level of interest p Slide #9 Chi-Square Tests
Examine HO Page 5 Slide #10 Chi-Square Tests


