Displaying Categorical Data: Bar and Pie Charts
This lesson explores the visual representation of categorical data using bar and pie charts. Learn how to create and interpret these graphs to display variable distributions clearly. Understand deceptive graph practices and master the skills to make accurate and informative data displays in Statistics and Probability with Applications, 3rd Edition.

Download Presentation

Please find below an Image/Link to download the presentation.
The content on the website is provided AS IS for your information and personal use only. It may not be sold, licensed, or shared on other websites without obtaining consent from the author.If you encounter any issues during the download, it is possible that the publisher has removed the file from their server.
You are allowed to download the files provided on this website for personal or commercial use, subject to the condition that they are used lawfully. All files are the property of their respective owners.
The content on the website is provided AS IS for your information and personal use only. It may not be sold, licensed, or shared on other websites without obtaining consent from the author.
E N D
Presentation Transcript
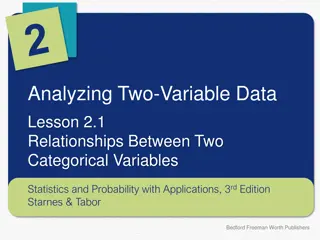
Analyzing One-Variable Data Lesson 1.2 Displaying Categorical Data Statistics and Probability with Applications, 3rdEdition Starnes, Tabor Bedford Freeman Worth Publishers
Displaying Categorical Data Learning Targets After this lesson, you should be able to: Make and interpret bar charts of categorical data. Interpret pie charts. Identify what makes some graphs of categorical data deceptive. Statistics and Probability with Applications, 3rd Edition 2
Displaying Categorical Data A frequency table or relative frequency table summarizes a variable s distribution in numerical form. To display the distribution more clearly, use a graph. Bar Chart A bar chart shows each category as a bar. The heights of the bars show the category frequencies or relative frequencies. Pie Chart A pie chart shows each category as a slice of pie. The areas of the slices are proportional to the category frequencies or relative frequencies. Statistics and Probability with Applications, 3rd Edition 3
Displaying Categorical Data How to Make a Bar Chart 1. Draw and label the axes. Put the name of the categorical variable under the horizontal axis. To the left of the vertical axis, indicate if the graph shows the frequency (count) or relative frequency (percent or proportion) of individuals in each category. 2. Scale the axes. Write the names of the categories at equally spaced intervals under the horizontal axis. On the vertical axis, start at 0 and place tick marks at equal intervals until you exceed the largest frequency or relative frequency in any category. 3. Draw bars above the category names. Make the bars equal in width and leave gaps between them. Be sure that the height of each bar corresponds to the frequency or relative frequency of individuals in that category. Statistics and Probability with Applications, 3rd Edition 4
Displaying Categorical Data 30 25 Level of Education Percent 20 Less than high school 13.2 Percent 15 High school graduate 22.6 Some college 28.7 10 Bachelor s degree 24.9 5 Advanced degree 10.6 0 Less than High school Some Bachelor s Advanced high school graduate Educational Level college degree degree Statistics and Probability with Applications, 3rd Edition 5
Displaying Categorical Data You can use a pie chart when you want to emphasize each category s relation to the whole. Educational Achievement US 25-34 year olds Advanced degree 10.6% Less than high school 13.2% Level of Education Percent Less than high school 13.2 High school graduate 22.6 Bachelor s degree 24.9% Some college 28.7 High school graduate 22.6% Bachelor s degree 24.9 Advanced degree 10.6 Some college 28.7% Statistics and Probability with Applications, 3rd Edition 6
Who wants to party with frequency? Who wants to party with frequency? Making and interpreting a bar graph Making and interpreting a bar graph PROBLEM: Below is a frequency table of the preferred party for the 30 students in Mr.Tyson s statistics class from Lesson 1.1. Make a bar graph to display the data. Describe what you see. SOLUTION: 20 18 16 14 Frequency 12 10 8 6 4 2 0 Donut Pasta Pizza Preferred party More than half of the class preferred a pasta party, making it the clear winner. A pizza party was the second-most preferred party, but the number of students who chose the pizza party (7 students) was less than half the number who chose the pasta party (18 students). Only 5 students chose the donut party, the least popular choice. Statistics and Probability with Applications, 3rd Edition 7
Will you be a Will you be a- -round for the party? round for the party? Interpreting pie charts Interpreting pie charts PROBLEM: Here is a pie chart of the preferred party data from the previous example. Explain why the Pizza slice makes up 23.3% of the graph. Preferred party Donut 16.7% Pizza 23.3% Pasta 60.0% SOLUTION: Because the relative frequency for the Pizza category is 7/30 = 0.233 or 23.3%. Statistics and Probability with Applications, 3rd Edition 8
Displaying Categorical Data Bar charts and pie charts can display a distribution of categorical data. A bar chart can also be used to compare the distribution of a categorical variable in two or more groups. It s a good idea to use relative frequencies (percents or proportions) when comparing, especially if the groups have different sizes. Statistics and Probability with Applications, 3rd Edition 9
Displaying Categorical Data Bar charts are a bit dull to look at. It is tempting to replace the bars with pictures or to use special 3-D effects to make the graphs seem more interesting. Don t do it! Our eyes react to the area of the bars as well as to their height. When all bars have the same width, the area varies in proportion to the height, and our eyes receive the right impression about the quantities being compared. Preferred Party Frequency Donut 5 Pasta 18 Pizza 7 Total 30 Statistics and Probability with Applications, 3rd Edition 10
Would you shop until you drop? Would you shop until you drop? Beware the pictograph! Beware the pictograph! PROBLEM: In an online poll in a recent year, Harris Interactive (www.harrisinteractive.com) asked adults from several countries if they like to shop for new clothes. The percent of adults in the U.S., Great Britain, and China who said that they like to shop for new clothes is shown in the table below. Statistics and Probability with Applications, 3rd Edition 11
Would you shop until you drop? Would you shop until you drop? Beware the pictograph! Beware the pictograph! (a) Here s a clever graph of the data that uses pictures instead of bars. How is this graph misleading? SOLUTION: (a) The pictograph makes it seem like the percentage of Chinese adults who like to shop for new clothes is about four times larger than the percentage of U.S. adults who like to shop for new clothes, which isn t true. Statistics and Probability with Applications, 3rd Edition 12
Would you shop until you drop? Would you shop until you drop? Beware the pictograph! Beware the pictograph! (b) Here is a bar graph of the data. Why could this graph be considered deceptive? 90 80 70 Percent 60 50 40 30 United States Great Britain Country China SOLUTION: (b) The bar graph is misleading. By starting the vertical scale at 30 instead of 0, it looks like the percentage of British adults who like to shop for new clothes is more than 2 times larger than percentage of U.S. adults who like to shop for new clothes, which isn t so. It also looks as if the percentage of Chinese adults who like to shop for new clothes is about 5 times larger than percentage of U.S. adults who like to shop for new clothes, which also is false. Statistics and Probability with Applications, 3rd Edition 13
LESSON APP 1.2 Which cell phone speaks to you? The Pew Research Center asked a random sample of 2024 adult cell-phone owners from the United States which type of cell phone they own: iPhone, Android, or other (including non-smartphones). The side-by-side bar chart displays the distribution of phone ownership for each of three age groups. The frequency table displays the results. 1. Make a bar chart to display the distribution of phone ownership among all 2024 people in the sample. Describe what you see. 2. Write a few sentences comparing the distributions of phone ownership for the three age groups. Statistics and Probability with Applications, 3rd Edition 14
LESSON APP 1.2 Which cell phone speaks to you? Statistics and Probability with Applications, 3rd Edition 15
Displaying Categorical Data Learning Targets After this lesson, you should be able to: Make and interpret bar charts of categorical data. Interpret pie charts. Identify what makes some graphs of categorical data deceptive. Statistics and Probability with Applications, 3rd Edition 16