Understanding Inference Tests and Chi-Square Analysis
The content discusses the application of inference tests to determine if two variables are related, focusing on categorical and quantitative variables. It provides examples related to testing fairness of a die and comparing observed and expected distributions of Skittles colors. Additionally, it covers Chi-Square tests for Goodness of Fit and Homogeneity/Independence, explaining their formulas and distributions. The Chi-Square analysis assesses whether observed distributions match expected ones under specific hypotheses, with defined conditions for data suitability.
Download Presentation

Please find below an Image/Link to download the presentation.
The content on the website is provided AS IS for your information and personal use only. It may not be sold, licensed, or shared on other websites without obtaining consent from the author. Download presentation by click this link. If you encounter any issues during the download, it is possible that the publisher has removed the file from their server.
E N D
Presentation Transcript
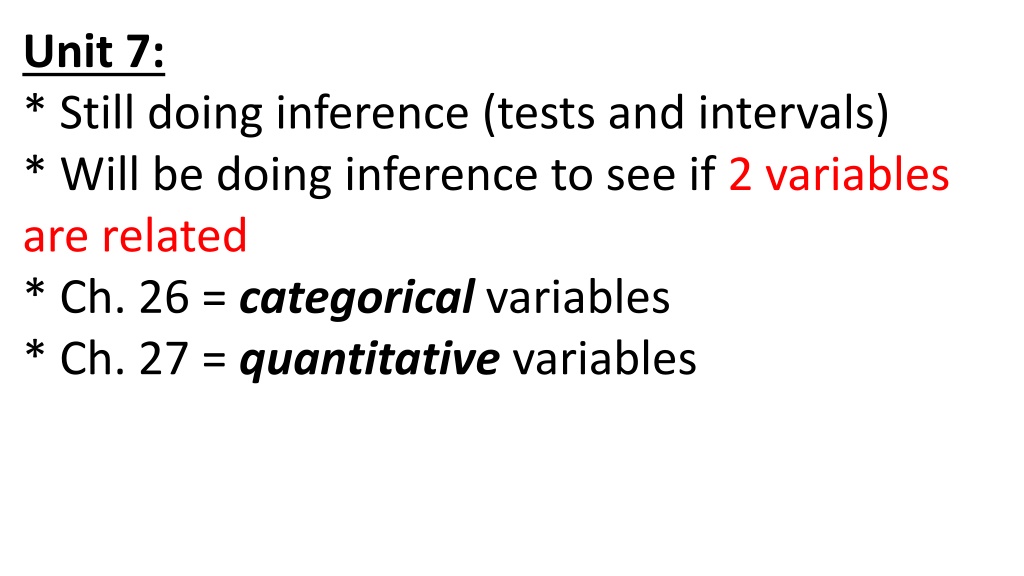
Unit 7: * Still doing inference (tests and intervals) * Will be doing inference to see if 2 variables are related * Ch. 26 = categorical variables * Ch. 27 = quantitative variables
these examples are not in the notes... just read thru them EXAMPLE 1: I want to test to see if a die is fair. So I roll the die 60 times and find the following distribution: Does the die seem fair? Is ONE category being very different enough to say the WHOLE die isn't fair??
EXAMPLE 2: I want to see if the distribution of colors of Skittles is the same as what is claimed by the company. The company claims that the distribution is: RED 30% GREEN 10% ORANGE 20% YELLOW 15% PURPLE 25% I take a sample of 200 skittles and get the following results: RED GREEN ORANGE 66 24 62 YELLOW 20 PURPLE 28 Do the observed and expected seem to match up??
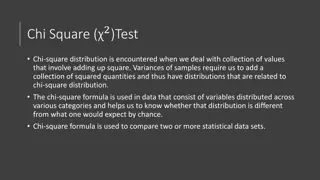
CH. 26: CHI- SQUARE TESTS There are 2 tests (no intervals): 1- Goodness of Fit 2- Homogeneity/Independence All use the Chi-Square variable for the test statistic: c2 All have the same formula for the test statistic: c2 =
Chi-Square distribution: Uses df (there is more than one distribution) Skewed right, unimodal Picture: page A-77 in book or Table C on formula sheet Less right skewed as df increases: if df = , then c2 = normal
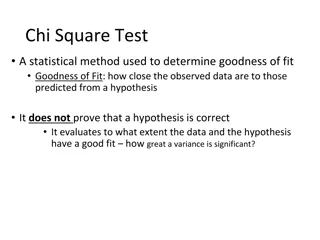
TEST #1: Chi-Square Goodness of Fit test Used to test whether an observed distribution fits/matches an expected distribution Hypotheses: (written sentences, always in context!) Ho: The observed distribution of _____ fits the expected distribution of ____ Ha: The observed distribution of ______doesn't fit the expected distribution of _______
Conditions: 1) Categorical data 1) the variable is categorical 2) Random 3) all expected counts are > 5 3) show all expected counts and then state that they are all above 5. conditions met --> c2 distribution --> c2 GOF test
Mechanics: Test statistic: P(c2 > test statistic) = c2cdf(test stat, E99, df) P-value: df = # categories (or outcomes) - 1 EX: Dice rolls: 6 outcomes/categories, df = 5
Conclusion: same 2 sentences: * reject/fail to reject Ho.... * Sufficient/Insufficient evidence... (re-copy the Ha)
Calculator: L1 = observed values L2 = expected values --------------------------------------------------------------------------- new calculators: STAT --> TESTS --> c2 GOF test
Example: Does color impact the chance that a car is stolen? Suppose it is known that of all cars 15% are white, 15% are blue, 30% are black, 35% are red, and 5% are other colors. A random sample of 830 stolen cars is taken and their colors are noted below. Test to see if the cars stolen match the distribution of all cars. Color White Blue Black Observed 140 100 230 Other 90 Red 270
A recent US Census showed the various ethnic groups in a particular state to be as follows: White = 74.3%, Black = 21.6%, American Indian = 1.2%, Hispanic = 1.2%, Asian = 0.8%, and Other = 0.9% Five years later, a random sample of 2,500 residents in that state was taken. The results were as follows: White = 1732, Black = 538, American Indian = 32, Hispanic = 42, Asian = 133, and Other = 23. Is there sufficient evidence at the 1% significance level to conclude that the distribution of ethnic groups in this state has changed in the past 5 years?
