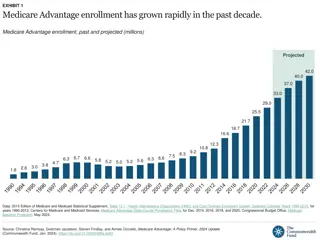
Medicare Part D Prescription Drug Benefits Overview

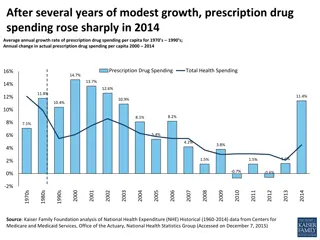
Detailed information on the standard Medicare Part D prescription drug benefit for 2013, including coverage details for catastrophic, brand-name, and generic drugs. Additionally, data on the distribution of Part D plans by benchmark status, weighted average premiums, and premium trends for high-enrollment plans from 2006 to 2013 are provided.

Download Presentation

Please find below an Image/Link to download the presentation.
The content on the website is provided AS IS for your information and personal use only. It may not be sold, licensed, or shared on other websites without obtaining consent from the author. Download presentation by click this link. If you encounter any issues during the download, it is possible that the publisher has removed the file from their server.
E N D
Presentation Transcript
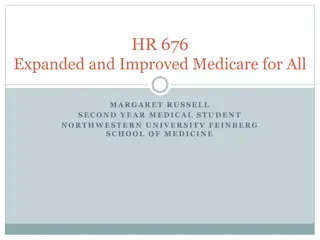
Exhibit 1 Standard Medicare Prescription Drug Benefit, 2013 CATASTROPHIC COVERAGE Catastrophic Coverage Limit = $6,955 in Estimated Total Drug Costs Enrollee pays 5% Plan pays 15%; Medicare pays 80% Brand-name drugs Enrollee pays 47.5%; Plan pays 2.5% 50% manufacturer discount COVERAGE GAP Generic drugs Enrollee pays 79%; Plan pays 21% Initial Coverage Limit = $2,970 in Total Drug Costs Enrollee pays 25% INITIAL COVERAGE PERIOD Plan pays 75% Deductible = $325 DEDUCTIBLE NOTE: *Amount corresponds to the estimated catastrophic coverage limit for non-low-income subsidy enrollees ($6,734 for LIS enrollees), which corresponds to True Out-of-Pocket (TrOOP) spending of $4,750 (the amount used to determine when an enrollee reaches the catastrophic coverage threshold. SOURCE: Kaiser Family Foundation illustration of standard Medicare drug benefit for 2013 (standard benefit parameter update from Centers for Medicare & Medicaid Services, 2012). Amounts rounded to nearest dollar.
Exhibit 2 Distribution of Medicare Part D Stand-Alone Prescription Drug Plans, by Benchmark Status, 2006-2013 Non-benchmark plans 1,875 1,824 De minimis plans* 1,689 Benchmark plans 1,576 1,429 1,235 1,109 1,041 1,031 1,329 1,381 1,269 1,020 777 714 700 157 53 74 75 113 483 442 409 308 307 258 252 218 2006 2007 2008 2009 2010 2011 2012 2013 NOTE: Excludes PDPs in the territories. *Under a Medicare demonstration, de minimis plans were eligible to retain LIS beneficiaries despite exceeding the benchmark premium by $2 in 2007 and $1 in 2008. SOURCE: Georgetown/NORC/Kaiser Family Foundation analysis of CMS PDP Landscape Source Files, 2006-2013.
Exhibit 3 Weighted Average Monthly Premiums for Medicare Part D Stand-Alone Prescription Drug Plans, 2006-2013 $38.29 $37.78 $38.54 $40 $37.25 $35.09 $35 $29.89 2012-2013: 2% increase $30 $27.39 $25.93 $25 $20 2006-2013: 49% increase $15 $10 $5 $- 2006 2007 2008 2009 2010 2011 2012 2013 NOTE: Average premiums are weighted by enrollment in each year (March for 2013). Excludes Part D plans in the territories. SOURCE: Georgetown/NORC analysis of data from CMS for the Kaiser Family Foundation.
Exhibit 4 Premiums in Medicare Part D Stand-Alone Prescription Drug Plans with Highest 2013 Enrollment, 2006-2013 2013 Enrollment (of 18.0 million) Weighted Average Monthly Premium1 % Change Name of PDP % of Total 2012- 2013 2006- 2013 Number 2006 2012 2013 AARP MedicareRx Preferred 3,851,372 21.4% $26.31 $39.85 $40.45 +2% +54% SilverScript Basic 3,022,209 16.8% $30.94 $30.75 $33.05 +7% +7% Humana Walmart-Preferred2 1,755,007 9.7% -- $15.10 $18.50 +23% -- Humana Enhanced 1,313,701 7.3% $14.73 $39.58 $43.74 +11% +197% Cigna Medicare Rx Plan One 684,543 3.8% $35.05 $31.09 $35.72 +15% +2% First Health Part D Premier 676,334 3.8% $24.98 $32.56 $38.32 +18% +30% First Health Part D Value Plus3 644,920 3.6% -- $25.43 $29.50 +16% -- NOTE: 1Average premiums are weighted by enrollment in each region for each year. 2Humana Walmart-Preferred PDP was not offered before 2011. 3First Heath Part D Value Plus PDP was not offered before 2012. SOURCE: Georgetown/NORC analysis of CMS 2006-2013 PDP Landscape Source Files for the Kaiser Family Foundation.
Exhibit 5 Weighted Average Premium for Medicare Part D Basic Stand-Alone PDPs, by Region, 2013 Less than $30 (9 regions) $30 to <$32 (7 regions) $32 to <$34 (9 regions) $34 or higher (9 regions) $33.23 ME, NH $33.65 OR, WA $29.56 CT, MA, RI, VT $33.24 IA, MN, MT, NE, ND, SD, WY $34.59 $41.50 $32.11 $34.12 NJ $38.83 ID, UT $35.09 PA, WV $28.47 $32.22 $23.13 $38.84 DE, DC, MD $34.21 IN, KY $28.82 $25.53 $32.18 $31.81 $27.66 $30.64 $32.48 AL, TN $35.09 $32.34 $30.65 $28.53 $20.67 $32.13 $31.44 $34.56 $31.85 $30.61 $24.67 FL $31.96 HI 2013 National Monthly Average Premium for Basic PDPs = $31.98 NOTE: PDP is stand-alone prescription drug plan. Average premiums are weighted by enrollment. SOURCE: Georgetown/NORC analysis of CMS 2013 PDP Landscape Source File for the Kaiser Family Foundation.
Exhibit 6 Range of Monthly Premiums for National and Near- National Medicare Part D Basic Stand-Alone PDPs, 2013 $81.00 (FL) $61.00 (CA) $57.30 (FL) $55.80 (CA) $49.60 (NV) $46.50 (AK) $45.20 (ID/UT) $42.70 (AK) $42.10 (ID/UT) $41.70 (ID/UT) $32.50 (several) $18.50 (all regions) $15.00 (all regions) $34.50 (AR,NC) $29.20 (AZ) $28.00 (AZ) $26.50 (AZ) $26.20 (NM) $25.50 (NM) $24.50 (NM) $23.70 (NM) $23.10 (NM) $22.10 (NM) $18.30 (NM) SilverScript Basic HealthSpring PDP AARP MedicareRx Saver Aetna CVS/pharmacy PDP SmartD Rx Saver Humana Walmart- WellCare Classic Readers Digest Value Rx First Health Part D Express Scripts Medicare- United American-Select Cigna Medicare Rx Plan EnvisionRxPlus Silver Preferred Premier One Value Plus NOTE: PDP is stand-alone prescription drug plan. SOURCE: Georgetown/NORC analysis of CMS 2013 PDP Landscape Source File for the Kaiser Family Foundation.
Exhibit 7 Minimum and Maximum Monthly Premiums for Medicare Part D Basic Stand-Alone PDPs, by Region, 2013 $105.80 Delaware, Maryland, DC Hawaii Florida $100 $82.00 Texas Georgia New York California Illinois $81.00 $80.50 $71.10 $80 $66.50 $64.10 $63.80 $61.40 $61.00 $61.00 $57.70 $57.00 $56.80 $56.70 $56.70 $54.40 $53.10 $52.90 $52.50 $52.50 $51.40 $51.30 $51.20 $50.30 $50.30 $50.20 $49.10 $49.10 $47.60 $60 $46.00 $45.00 $41.10 $40.50 $40 $20 $18.50 $18.50 $18.50 $18.50 $15.00 $15.00 $15.00 $15.00 $15.00 $15.00 $15.00 $15.00 $15.00 $15.00 $15.00 $15.00 $15.00 $15.00 $15.00 $15.00 $15.00 $15.00 $15.00 $15.00 $15.00 $15.00 $15.00 $15.00 $15.00 $15.00 $15.00 $15.00 $15.00 $15.00 $0 PDP Region # 33 10 26 19 7 PDP Regions, Sorted from Lowest to Highest Maximum Monthly Premium 1 20 18 15 22 21 14 28 2 16 29 9 3 12 13 23 24 34 8 32 27 6 25 4 17 31 11 30 5 NOTE: PDP is stand-alone prescription drug plan. SOURCE: Georgetown/NORC analysis of CMS 2013 PDP Landscape Source File and Plan Crosswalk for the Kaiser Family Foundation.
Exhibit 8 Weighted Average Monthly Premiums for Stand-Alone PDPs, by Type of Benefit Package, 2013 Enhanced benefit package Basic benefit package $100.02 $33.78 $48.70 $43.09 $12.00 $31.98 $9.62 $66.24 $36.70 $33.47 $31.98 Basic Enhanced Enhanced (first plan option) Enhanced (second plan option) Type of benefit package NOTE: PDP is stand-alone prescription drug plan. SOURCE: Georgetown/NORC analysis of data from CMS for the Kaiser Family Foundation.
Exhibit 9 Share of Enrollment in Medicare Part D Plans, By Level of Gap Coverage, 2006 and 2013 In 2013, the coverage gap is partially filled by a 50% price discount plus 2.5% plan coverage for brand- name drugs and 21% coverage of generic drug costs, as required by the ACA Level of gap coverage in 2006: PDPs MA-PD plans Little/no gap coverage Mostly generics Brands & generics 65% 73% Level of additional gap coverage in 2013: Little/no additional gap coverage 94% 94% Mostly generics 35% 23% 3% 2% Brands & generics <1% 4% 3% 3% 2006 2013 2006 2013 NOTE: Estimates include Part D enrollees receiving low-income subsidies, but who receive coverage for costs in the gap regardless of whether their plan offers it. SOURCE: Georgetown/NORC analysis of CMS Part D landscape and enrollment files, 2006-2013, for the Kaiser Family Foundation.
Exhibit 10 Weighted Average Monthly Premiums for Medicare Part D Stand-Alone PDPs, by Level of Gap Coverage, 2013 In 2013, the coverage gap is partially filled by a 50% price discount plus 2.5% plan coverage for brand-name drugs and 21% coverage of generic drug costs, as required by the ACA $101.32 $79.51 $35.19 Little/no additional gap coverage Mostly generics Brands & generics Level of additional gap coverage in 2013 NOTE: PDP is stand-alone prescription drug plan. SOURCE: Georgetown/NORC analysis of data from CMS for the Kaiser Family Foundation.
Exhibit 11 Share of Medicare Part D Stand-Alone Prescription Drug Plans, By Deductible Amount, 2006-2013 No deductible 40% 42% 45% 47% Partial deductible 55% 58% 59% 60% Standard deductible 10% 18% 24% 10% 11% 8% 8% 8% 45% 43% 40% 36% 34% 34% 33% 32% Standard deductible amount: 2006 2007 2008 2009 2010 2011 2012 2013 $250 $265 $275 $295 $310 $310 $320 $325 NOTE: Estimates may not sum to total due to rounding and are unweighted. SOURCE: Georgetown/NORC analysis of CMS PDP landscape source files, 2006-2013, for the Kaiser Family Foundation.
Exhibit 12 Cost Sharing for Medicare Part D Plans, 2006-2013, and Employer-Sponsored Plans, 2013 EMPLOYER PLANS PART D PLAN TYPE PART D COST SHARING FORMULARY TIER 2012 2013 2006 2007 2008 2009 2010 2011 2013 PDP $7 $5 $2 $5 $5 $5 $7 $7 Generic $10 MA-PD $6 $6 $5 $5 $5 $5 $5 $6 PDP $42 $41 $40 $28 $28 $30 $37 $42 Preferred brand $29 MA-PD $40 $42 $45 $26.70 $29 $30 $30 $39 Non- preferred brand PDP $78 $92 $85 $55 $60 $71.50 $74.75 $76.50 $52 MA-PD $80 $84 $90 $55 $60 $60 $60 $79 PDP 30% 29% 26% 25% 30% 30% 33% 30% Specialty 32% MA-PD 33% 33% 33% 25% 25% 25% 33% 33% NOTES Part D cost-sharing amounts are medians; employer plan cost-sharing amounts are means. Part D plan estimates weighted by enrollment in each year; analysis excludes generic/brand plans, plans with coinsurance for regular tiers, and plans with flat copayments for specialty tiers. SOURCE: Georgetown/NORC analysis of data from CMS for MedPAC and the Kaiser Family Foundation; data on employer plans from Kaiser/HRET Employer Health Benefits Survey, 2013.
Exhibit 13 Share of Enrollment in Medicare Part D Plans with Specialty Tiers, by Specialty Tier Coinsurance Rate, 2009-2013 PDPs MA-PD plans 41% 47% 48% 48% Coinsurance rates: 56% 57% 75% 81% 33% 82% 87% 11% 2% 26%-32% 14% 19% 4% 25% 6% <25% 50% 49% 3% 39% 38% 37% 4% 34% 5% 19% 6% 14% 12% 7% 2% 1% 1% <1% 2% 2009 2010 2011 2012 2013 2009 2010 2011 2012 2013 NOTE: Estimates weighted by enrollment in each year. Analysis of MA-PD plans excludes Special Needs Plans. SOURCE: Georgetown/NORC analysis of data from CMS for the Kaiser Family Foundation.
Exhibit 14 Share of Medicare Part D Stand-Alone PDP Enrollees with Coverage of Top Ten Brand-Name Drugs, by Formulary Tier, 2013 Preferred brand tier Non-preferred tier Not listed Nexium 66% 12% 21% Crestor 73% 1% 26% Advair Diskus 72% 16% 11% Namenda 100% Lantus 86% 1% 13% Spiriva 80% 20% Cymbalta 43% 57% Zetia 60% 40% Celebrex 35% 42% 22% Lyrica 47% 53% NOTE: PDP is stand-alone prescription drug plan. Analysis is weighted by enrollment. Preferred brand includes plans using standard benefit without tiers. Non-preferred brand includes plans using specialty tiers. SOURCE: NORC/Social & Scientific Systems analysis of data from CMS.
Exhibit 15 Share of Covered Drugs with Utilization Management (UM) Restrictions Across All Medicare Part D Stand-Alone PDPs, 2007-2013 2007 2008 2009 2010 2011 2012 2013 36% 35% 32% 28% 26% 21% 21% 21% 20% 19% 18% 18% 17% 16% 16% 15% 14% 12% 12% 9% 8% 3% 3% 2% 2% 2% 1% 1% Any UM Restriction NOTE: PDP is stand-alone prescription drug plan. Calculations are share of listed chemical entities, weighted by enrollment in each year. SOURCE: NORC/Social & Scientific Systems analysis of data from CMS. Prior Authorization Step Therapy Quantity Limits
Exhibit 16 Share of Medicare Part D Stand-Alone PDP Enrollees Facing UM Restrictions for Top Ten Brand-Name Drugs, 2013 % Enrollees with Drug Not Covered % Enrollees with Prior Authorization % Enrollees with Step Therapy % Enrollees with Quantity Limits Top Brand- Name Drug % Enrollees with Any UM 21% 61% 0% 0% 57% Nexium 26% 83% 0% 9% 82% Crestor 11% 79% 0% 4% 79% Advair Diskus 0% 76% 0% 0% 76% Namenda 13% 30% 0% 0% 30% Lantus 0% 78% 0% 0% 78% Spiriva 0% 86% 20% 8% 83% Cymbalta 0% 73% 7% 2% 72% Zetia 22% 74% 40% 26% 73% Celebrex 0% 82% 25% 13% 74% Lyrica NOTE: PDP is stand-alone prescription drug plan. UM is utilization management. Presence of UM restrictions is measured as a share of plans with the drug listed on formulary. SOURCE: NORC/Social & Scientific Systems analysis of data from CMS.
Exhibit 17 Distribution of Monthly Part D Premiums for Low-Income Subsidy PDP Enrollees Paying Premiums, 2006-2013 2% 5% 7% 7% 8% 9% 11% 14% 10% 27% 13% 26% 31% 34% 30% 24% More than $25 36% $25-$10 28% 22% $10-$5 37% 29% $5-$2 36% 42% 38% 25% Less than $2 35% 40% 14% 26% 11% 25% 24% 20% 12% 16% 11% 9% 6% 4% 2006 2007 2008 2009 2010 2011 2012 2013 Of Total LIS Enrollees, Share Paying Premiums: 6% 7% 21% 26% 22% 13% 17% 19% Number Paying Premiums: 488,400 530,100 1,718,800 2,042,200 1,731,000 1,040,100 1,433,900 1,597,500 Average premiums: $9.20 $12.69 $6.87 $11.10 $9.95 $14.71 $12.45 $11.82 NOTE: PDP is stand-alone prescription drug plan. SOURCE: Georgetown/NORC analysis of CMS 2006-2013 PDP Landscape and Enrollment files for the Kaiser Family Foundation.
Exhibit 18 Number of Low-Income Subsidy PDP Enrollees Paying Monthly Premiums, 2006-2013 Paying Any Premiums 2,042,200 Paying $10 or More 1,731,000 1,718,800 1,597,500 1,423,900 1,040,100 821,300 614,400 575,400 555,900 530,100 517,500 488,400 259,800 257,800 112,900 2006 2007 2008 2009 2010 2011 2012 2013 NOTE: PDP is stand-alone prescription drug plan. SOURCE: Georgetown/NORC analysis of CMS 2006-2013 PDP Landscape and Enrollment files for the Kaiser Family Foundation.
Exhibit 19 Share of Medicare Part D Stand-Alone PDPs and PDP Enrollees, by Plan Star Ratings, 2013 Distribution of PDPs by quality ratings: Distribution of PDP enrollees, by quality ratings: <1% 2% 4 or more stars <1% <1% 8% 6% 5 stars 23% 4.5 stars 30% 4 stars 3.5 stars 3 stars 45% 42% 2.5 stars 2 stars 23% 16% 3% <1% Total number of PDPs = 1,031 Total enrollment = 17.9 million NOTE: PDP is stand-alone prescription drug plan. Unrated plans are excluded from percentages. SOURCE: Georgetown/NORC/Kaiser Family Foundation analysis of CMS Ratings, 2013.
Exhibit 20 Top 10 Firms Offering Medicare Part D Plans Ranked by 2013 Enrollment Change in Total Enrollment, 2006-2013 2013 2006 Name of firm Enrollment (in millions) % of Total Part D in 2013 Rank Rank 1 7.86 22.3% 1 +38% UnitedHealth Group 2 5.17 14.7% 2 +19% Humana 3 4.51 12.8% 11 +920% CVS Caremark 4 2.75 7.8% 10 +563% Express Scripts 5 2.58 7.3% 12 +530% Aetna 6 1.65 4.7% 17 +675% CIGNA 7 1.12 3.2% 6 +44% Kaiser Permanente 8 1.06 3.0% 3 -19% Wellpoint 9 1.01 2.9% 4 +3% WellCare Health Plans 10 0.47 1.3% N/A N/A Envision 28.2 mil TOTAL TOP 10 FIRMS 79.9% 35.3 mil TOTAL PART D 100.0% NOTE: Includes plans in the territories and employer plans. SOURCE: Georgetown/NORC/Kaiser Family Foundation analysis of CMS Enrollment Files, 2006-2013.
Exhibit 21 Top 10 Medicare Part D Plans Ranked by 2013 Enrollment 2013 2006 Change 2006-2013 Name of Plan Enrollment (in millions) % of Total Part D in 2013 Rank Rank AARP MedicareRx Preferred PDP 1 3.87 11.0% 1 +21% 2 3.04 8.6% 5 +284% SilverScript Basic PDP* Express Scripts Medicare PDP (Employer)** Humana Walmart-Preferred PDP 3 2.33 6.6% 11 +461% 4 1.76 5.0% N/A N/A 5 1.32 3.7% 3 +37% Humana Enhanced PDP SilverScript Group Calendar PDP (Employer) N/A N/A 6 0.94 2.7% 7 0.81 2.3% 14 +113% Humana Gold Plus HMO Kaiser Permanente Senior Advantage HMO Cigna Medicare Rx Plan One PDP First Health Part D Premier PDP 8 0.77 2.2% 7 +16% 9 0.69 2.0% 29 +470% 10 0.68 1.9% 18 +157% NOTE: Includes plans in the territories and employer plans. SOURCE: Georgetown/NORC/Kaiser Family Foundation analysis of CMS Enrollment Files, 2006-2013.
Exhibit 22 Top 5 Medicare Part D Stand-Alone PDPs, Ranked by 2013 LIS Enrollment and Non-LIS Enrollment Number of Regions Where PDP is Benchmark Plan Total LIS Enrollment Share of All LIS Enrollees Share LIS in Plan Prescription Drug Plan SilverScript Basic 2,601,000 31.6% 86.0% 30 Humana Walmart-Preferred Rx Plan 926,000 11.2% 52.8% 34 AARP MedicareRx Preferred 737,000 8.9% 19.1% 0 Cigna Medicare Rx Plan One 592,000 7.2% 86.4% 21 WellCare Classic 436,000 5,292,000 Total Non- LIS Enrollment 5.3% 64.2% Share of All Non-LIS Enrollment 69.0% 19 TOTAL FOR TOP 5 LIS PDPs Share Non- LIS in Plan Number of Regions Where PDP is Benchmark Plan Prescription Drug Plan AARP MedicareRx Preferred 3,114,000 31.9% 80.9% 0 Humana Enhanced 1,134,000 11.6% 86.3% 0 Humana Walmart-Preferred Rx Plan 829,000 8.5% 47.2% 34 First Health Part D-Value Plus 617,000 6.3% 95.7% 0 SilverScript Basic 422,000 6,116,000 4.3% 62.6% 14.0% 30 TOTAL FOR TOP 5 NON-LIS PDPs NOTE: LIS is low-income subsidy. Excludes employer group plans and plans in the territories. SOURCE: Georgetown/NORC analysis of CMS PDP Landscape and Enrollment Files, 2013, for the Kaiser Family Foundation.