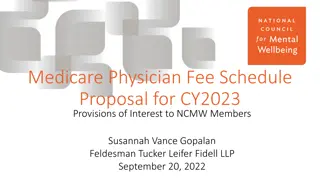
Overview of U.S. Prescription Drug Spending and Medicare Part D

U.S. prescription drug spending data from 2005 to 2025 shows trends in various payer contributions, with predictions for future years. Medicare Part D's drug spending is broken down, revealing top drugs and rebate percentages. The total Medicare spending in 2015 and average annual growth in Medicare Part D are also highlighted.

Download Presentation

Please find below an Image/Link to download the presentation.
The content on the website is provided AS IS for your information and personal use only. It may not be sold, licensed, or shared on other websites without obtaining consent from the author. Download presentation by click this link. If you encounter any issues during the download, it is possible that the publisher has removed the file from their server.
E N D
Presentation Transcript
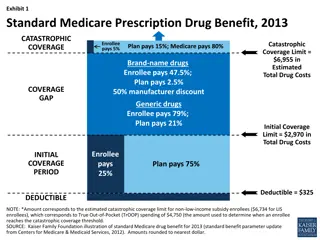
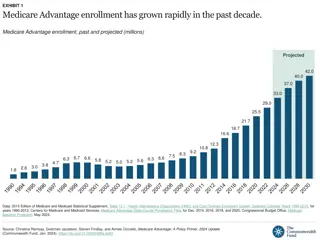
Total U.S. prescription drug spending, in $ billions: Medicare Actual Projected Medicaid $597 $561 Out of pocket $528 Other payers $496 35% $466 Private health insurance 34% $438 34% $412 33% $387 33% $360 Part D begins 32% $341 10% $325 31% 10% 31% 10% $298 10% 30% 11% 10% 30% $224$236$241$253 $253$259 $259$265 11% 29% 10% 12% 10% 28% 12% 4% 10% 12% 4% 10% $205 28% 12% 24% 4% 26% 22% 23% 10% 10% 12% 21% 4% 20% 18% 12% 2% 4% 9% 4% 13% 8% 8% 8% 4% 18% 13% 8% 8% 8% 8% 14% 9% 4% 15% 4% 19% 4% 17% 18% 4% 17% 16% 21% 22% 23% 25% 4% 5% 5% 5% 41% 4% 5% 5% 41% 5% 41% 5% 6% 41% 42% 42% 43% 43% 43% 43% 44% 43% 45% 46% 46% 43% 44% 45% 45% 50% 45% 2005 2006 2007 2008 2009 2010 2011 2012 2013 2014 2015 2016 2017 2018 2019 2020 2021 2022 2023 2024 2025 SOURCE: Kaiser Family Foundation analysis of CMS National Health Expenditure Data for Historical (CY2005-2015) and Projected (CY2016-2025) Retail Prescription Drug Expenditures.
Medicare Part D drug spending Medicare Part B drug spending 14% 83% Other Medicare spending 3% Total Medicare Spending in 2015 = $647.6 billion SOURCE: MedPAC, June 2017 Report to the Congress, Chapter 2, Medicare Part B Drug Payment Policy Issues, and 2017 Annual Report of the Boards of Trustees of the Federal Hospital Insurance and Federal Supplementary Medical Insurance Trust Funds, Tables III.D1 and V.B1.
Top 10 drugs: Treatment for: 2.1% 3.2% 1.7% 1.6% 1.6% Harvoni Hepatitis C 5.1% Diabetes Lantus/Lantus Solostar 1.5%1.5% High cholesterol Crestor 1.3% Asthma Advair Diskus 1.2% Asthma/COPD Spiriva Diabetes Januvia Multiple myeloma Revlimid Acid reflux Nexium Lyrica Fibromyalgia/pain 79.3% Humira/Humira Pen Rheumatoid arthritis All other drugs Total Spending on Medicare Part D Prescription Drugs in 2015: $137 billion SOURCE: Kaiser Family Foundation analysis of CMS Part D Drug Utilization and Cost Summary, Calendar Year 2015..
Medicare Part D rebates as a percent of total drug costs: 25% 23.8% 22.0% 20% 18.2% 14.3% 15% 12.9% 10.4%11.1%11.3%11.5%11.7% 9.6% 10% 8.6% 5% 0% 2006 2007 2008 2009 2010 2011 2012 2013 2014 2015 2016 2017 SOURCE: 2017 Annual Report of the Boards of Trustees of the Federal Hospital Insurance and Federal Supplementary Medical Insurance Trust Funds, Table IV.B8.
Average annual growth in Medicare Part D per enrollee spending, actual and projected: 4.7% 4.4% 2.4% Actual: 2007-2013 Actual: 2013-2016 Projected: 2016-2026 SOURCE: Kaiser Family Foundation analysis of Medicare spending data from the 2017 Annual Report of the Boards of Trustees of the Federal Hospital Insurance and Federal Supplementary Medical Insurance Trust Funds, Table V.D1; 2017 Expanded and Supplementary Tables and Figures.
Annual Medicare Part D spending, in $ billions Retiree drug subsidy Actual Projected Reinsurance $193 Low-income subsidy $180 $168 Direct subsidy $157 $146 42% Premiums $135 42% $125 42% $115 41% 41% $104 41% $90 $92 $94 41% $82 41% 28% $44 $50 $54 $58 $63 $66 $69 $73 41% 28% 14%16%17%17%18%21%23%26%33%37%38% 40% 28% 28% 28% 28% 28% 28% 29% 16% 29% 29% 29% 30% 32% 15% 33% 15% 34% 34% 16% 34% 16% 34% 16% 33% 16% 34% 15% 15% 20% 16% 21% 23% 28% 30% 30% 32% 33% 15% 33% 15% 36% 15% 40% 15% 15% 15% 15% 15% 15% 15% 14% 13% 13% 13% 11% 11% 11% 11% 9% 8% 8% 2006 2007 2008 2009 2010 2011 2012 2013 2014 2015 2016 2017 2018 2019 2020 2021 2022 2023 2024 2025 2026 SOURCE: 2017 Annual Report of the Boards of Trustees of the Federal Hospital Insurance and Federal Supplementary Medical Insurance Trust Funds, Table IV.B10.
Medical providers 23% Prescription drugs (Part D) 18% Long-term care facility 34% Dental 9% Inpatient hospital 3% SNF & home health 8% Outpatient hospital 5% Average Out-of-Pocket Spending by Medicare Beneficiaries on Services in 2013: $3,257 NOTE: SNF is skilled nursing facility. Analysis excludes beneficiaries enrolled in Medicare Advantage plans and those in Part A or Part B only. SOURCE: Kaiser Family Foundation analysis of the Medicare Current Beneficiary Survey 2013 Cost & Use file.
Average out-of-pocket costs by Medicare Part D enrollees not receiving Low-Income Subsidies: $3,500 $3,041 $3,000 $2,500 $2,000 $1,500 $1,123 $1,000 $498 $500 $258 $0 Overall average Enrollees with drug spending below the coverage gap Enrollees with drug spending in the gap but below catastrophic threshold Enrollees with spending above the catastrophic threshold NOTE: Analysis includes enrollees in stand-alone prescription drug plans and Medicare Advantage drug plans; excludes enrollees receiving Low-Income Subsidies. Out-of-pocket costs include Part D drug costs, but not Part D premiums or costs for Part B-covered drugs. SOURCE: Kaiser Family Foundation analysis of a five percent sample of 2015 Medicare prescription drug event claims from the CMS Chronic Conditions Data Warehouse.
Average out-of-pocket spending by Medicare Part D enrollees with out-of-pocket spending above the catastrophic coverage threshold: $5,000 Phase-out of coverage gap begins $4,465 $4,367 $4,500 $4,055 $3,854 $4,000 $3,500 $3,058 $3,041 $3,004 $2,870 $2,789 $3,000 $2,500 $2,000 $1,500 $1,000 $500 $0 2007 2008 2009 2010 2011 2012 2013 2014 2015 NOTE: Analysis includes enrollees in stand-alone prescription drug plans and Medicare Advantage drug plans; excludes enrollees receiving Low-Income Subsidies. Out-of-pocket costs include Part D drug costs, but not Part D premiums or costs for Part B-covered drugs. SOURCE: Kaiser Family Foundation analysis of a five percent sample of 2007-2015 Medicare prescription drug event claims from the CMS Chronic Conditions Data Warehouse.
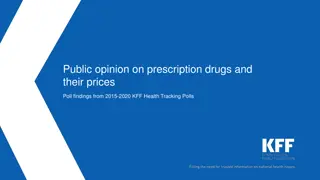
Percent who say they favor each of the following: DEM IND REP Allowing the federal government to negotiate with drug companies to get a lower price on medications for people on Medicare 96% 92% 92% Making it easier for generic drugs to come to market in order to increase competition and reduce costs 84% 91% 91% Requiring drug companies to release information to the public on how they set their drug prices 84% 88% 84% Limiting the amount drug companies can charge for high-cost drugs for illnesses like hepatitis or cancer 78% 79% 79% Creating an independent group that oversees the pricing of prescription drugs 74% 74% 71% 66% 77% 75% Allowing Americans to buy prescription drugs imported from Canada Allowing Americans to buy prescription drugs from online pharmacies based in Canada 73% 68% 59% Eliminating prescription drug advertisements 59% 59% 53% Encouraging people to buy lower-cost drugs by requiring them to pay a higher share if they choose a similar, higher cost drug 40% 60% 57% NOTE: Items asked of separate half samples. SOURCE: Kaiser Family Foundation Health Tracking Poll (conducted April 17-23, 2017).