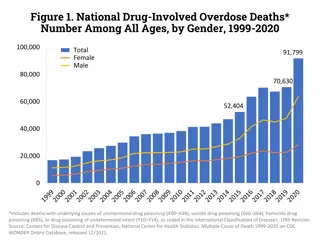
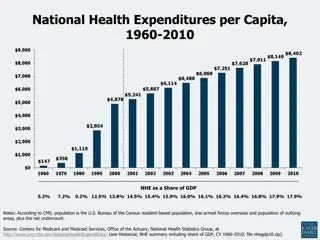
Trends in Prescription Drug Spending and Affordability

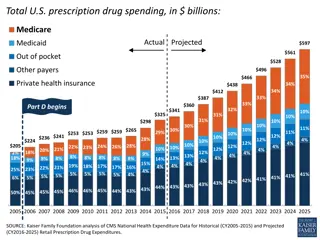
Prescription drug spending experienced significant growth in 2014, driven by costly specialty drugs. Medicare emerged as a major payer for prescription medications, with notable increases since 2004. While most individuals can afford their prescription drugs, a significant portion still struggles with the costs. These trends highlight the evolving landscape of healthcare expenditures and access to essential medication.

Download Presentation

Please find below an Image/Link to download the presentation.
The content on the website is provided AS IS for your information and personal use only. It may not be sold, licensed, or shared on other websites without obtaining consent from the author. Download presentation by click this link. If you encounter any issues during the download, it is possible that the publisher has removed the file from their server.
E N D
Presentation Transcript
After several years of modest growth, prescription drug spending rose sharply in 2014 Average annual growth rate of prescription drug spending per capita for 1970 s 1990 s; Annual change in actual prescription drug spending per capita 2000 2014 Prescription Drug Spending Total Health Spending 16% 14.7% 13.7% 14% 12.6% 11.8% 11.4% 12% 10.9% 10.4% 10% 8.2% 8.1% 8% 7.1% 5.4% 6% 4.2% 3.8% 4% 1.6% 1.5% 1.5% 2% -0.7% -0.6% 0% -2% 1970s 1980s 1990s 2007 2000 2001 2002 2003 2004 2005 2006 2008 2009 2010 2011 2012 2013 2014 Source: Kaiser Family Foundation analysis of National Health Expenditure (NHE) Historical (1960-2014) data from Centers for Medicare and Medicaid Services, Office of the Actuary, National Health Statistics Group (Accessed on December 7, 2015)
Costly new specialty drugs are a major driver of increased health spending Express Scripts drug spending growth trend by therapy class, 2006 -2014 Specialty Drug Trend Traditional Drug Trend Overall Drug Trend 35% 30.9% 30% 25% 20% 15% 14.1% 10% 6.4% 5% 2.4% 0% -5% 2006 2007 2008 2009 2010 2011 2012 2013 2014 Source: Express Scripts 2014 Drug Trend Report and Year in Review. Available at http://lab.express-scripts.com/drug-trend-report/ and http://lab.express-scripts.com/drug-trend-report/introduction/year-in-review
Medicare has become a major payer for prescription drugs Distribution of total national health expenditures on retail prescription drugs, by payer, 2004 and 2014 2004 2014 Other 4% Other 5%Medicare 2% Out-of- pocket 15% Out-of- pocket 25% Medicaid 19% Medicare 29% Private Insurance 43% Medicaid 9% Private Insurance 49% Source: Kaiser Family Foundation analysis of National Health Expenditure (NHE) data from Centers for Medicare and Medicaid Services, Office of the Actuary, National Health Statistics Group Note: The increase in Medicare spending on prescription drugs is largely due to the 2006 addition of the Medicare prescription drug benefit.
Most people taking Rx drugs say they can afford their treatment, but about 1 in 4 have a difficult time affording their medicine Among those who are currently taking Rx medicine, percent who report ease or difficulty affording the cost of their prescription medications Don't have to pay, 3% Dk/Ref, 1% Very difficult, 8% Somewhat difficult, 16% Very easy, 45% Somewhat easy, 27% Source: Kaiser Family Foundation Health Tracking Poll (conducted Aug 6 11, 2015)
The average price of Humira is about 15% higher in the U.S. than in Canada Average price for 1-month supply, 2013 $2,500 $2,246 $1,950 $2,000 $1,498 $1,500 $1,102 $1,000 $881 $500 $0 Switzerland England Netherlands Canada United States Source: International Federation of Health Plans Notes: U.S. average prices are calculated using commercial claims data from Truven MarketScan Research databases. Methods and sources for comparable countries can be found here: http://www.ifhp.com/1404121
The average price of Enbrel in the U.S. is about 35% higher than in Canada Average price for 1-month supply, 2013 $2,500 $2,225 $2,000 $1,646 $1,509 $1,500 $1,117 $1,017 $1,000 $500 $0 Switzerland England Netherlands Canada United States Source: International Federation of Health Plans Notes: U.S. average prices are calculated using commercial claims data from Truven MarketScan Research databases. Methods and sources for comparable countries can be found here: http://www.ifhp.com/1404121
Most Americans favor action to keep drug prices down Percent who say they favor each of the following in keeping prescription drug costs down: Requiring drug companies to release information to the public on how they set their drug prices 86% Allowing Medicare to negotiate with drug companies for lower drug prices 83% Limiting the amount drug companies can charge for high-cost drugs for illnesses like hepatitis or cancer 76% Allowing Americans to buy prescription drugs imported from Canada 72% 0% 10% 20% 30% 40% 50% 60% 70% 80% 90% 100% Source: Kaiser Family Foundation Health Tracking Poll (conducted August 6-11, 2015)