Prescription Drug Coverage in Medicare Enrollees with Chronic Kidney Disease

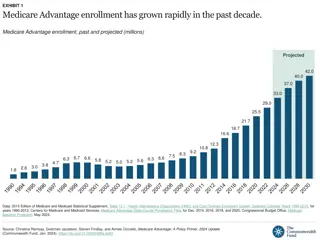
This report delves into the sources and parameters of prescription drug coverage in Medicare enrollees with chronic kidney disease (CKD) for the years 2010 to 2015. It explores the trends in Medicare Part D enrollment, out-of-pocket costs, and catastrophic coverage benefits. The data presented sheds light on the landscape of prescription drug coverage for individuals living with CKD under the Medicare program, highlighting key aspects such as deductible amounts, initial coverage limits, out-of-pocket thresholds, and catastrophic coverage triggers.

Download Presentation

Please find below an Image/Link to download the presentation.
The content on the website is provided AS IS for your information and personal use only. It may not be sold, licensed, or shared on other websites without obtaining consent from the author. Download presentation by click this link. If you encounter any issues during the download, it is possible that the publisher has removed the file from their server.
E N D
Presentation Transcript
2017 ANNUAL DATA REPORT VOLUME 1: CHRONIC KIDNEY DISEASE Chapter 7: Prescription Drug Coverage in Patients with CKD
vol 1 Figure 7.1 Sources of prescription drug coverage in Medicare enrollees, by population, 2015 Data source: Medicare 5% sample. Point prevalent Medicare enrollees alive on January 1, 2015. Abbreviations: CKD, chronic kidney disease; LIS, Medicare Low-income Subsidy; Part D, Medicare prescription drug coverage benefit. 2017 Annual Data Report Volume 1 CKD, Chapter 7 2
vol 1 Table 7.1 General Medicare and CKD patients enrolled in Part D General Medicare (%) 55.7 57.6 65.7 66.3 67.1 All CKD (%) 59.3 60.5 69.3 71.1 71.9 2011 2012 2013 2014 2015 Data source: Medicare 5% sample. Point prevalent Medicare enrollees alive on January 1. Abbreviations: CKD, chronic kidney disease; Part D, Medicare prescription drug coverage benefit. 2017 Annual Data Report Volume 1 CKD, Chapter 7 3
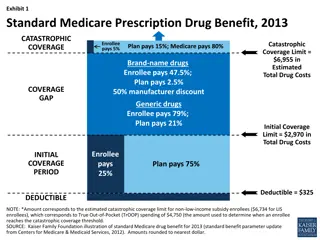
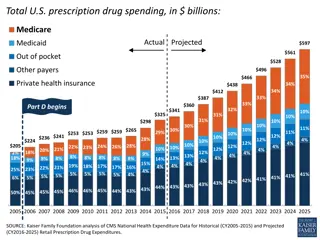
vol 1 Table 7.2 Medicare Part D parameters for defined standard benefit, 2010 & 2015 2010 2015 Deductible After the deductible is met, the beneficiary pays 25% of total prescription costs up to the initial coverage limit. Initial coverage limit The coverage gap ( donut hole ) begins at this point. The beneficiary pays 100% of their prescription costs up to the out-of- pocket threshold Out-of-pocket threshold The total out-of-pocket costs including the donut hole Total covered Part D prescription out-of-pocket spending $310 $320 $2,830 $2,960 $4,550 $4,700 $6,440.00 $6,680.00 Catastrophic coverage begins after this point (including the coverage gap). Catastrophic coverage benefit Generic/preferred multi-source drug $2.50 $6.30 *$2.65 *$6.60 plus a 55% brand-name medication discount Other drugs 2015 Example: $320 (deductible) $310.00 $320 +(($2960-$320)*25%) (initial coverage) $630.00 $660.00 +(($6680-$2960)*100%) (coverage gap) $3,610.00 $3,720.00 Total $4,550.00 $4,700.00 (maximum out-of-pocket costs prior to catastrophic coverage, excluding plan premium) *The catastrophic coverage amount is the greater of 5% of medication cost or the values shown in the chart above. In 2015, beneficiaries were charged $2.65 for those generic or preferred multisource drugs with a retail price less than $53 and 5% for those with a retail price over $53. For brand name drugs, beneficiaries paid $6.6 for those drugs with a retail price less than $132 and 5% for those with a retail price over $132. Table adapted from http://www.q1medicare.com/PartD-The- 2015-Medicare-Part-D-Outlook.php. 2017 Annual Data Report Volume 1 CKD, Chapter 7 4
vol 1 Figure 7.2 Sources of prescription drug coverage in Medicare enrollees, by age, 2015 (a) All general Medicare enrollees Data source: Medicare 5% sample. Point prevalent Medicare enrollees alive on January 1, 2015. Abbreviations: CKD, chronic kidney disease; LIS, Medicare Low-income Subsidy; Part D, Medicare prescription drug coverage benefit. 2017 Annual Data Report Volume 1 CKD, Chapter 7 5
vol 1 Figure 7.2 Sources of prescription drug coverage in Medicare enrollees, by age, 2015 (b) Enrollees with CKD Data source: Medicare 5% sample. Point prevalent Medicare enrollees alive on January 1, 2015. Abbreviations: CKD, chronic kidney disease; LIS, Medicare Low-income Subsidy; Part D, Medicare prescription drug coverage benefit. 2017 Annual Data Report Volume 1 CKD, Chapter 7 6
vol 1 Figure 7.3 Sources of prescription drug coverage in Medicare enrollees, by race, 2015 (a) All general Medicare enrollees Data source: Medicare 5% sample. Point prevalent Medicare enrollees alive on January 1, 2015. Abbreviations: Blk/Af Am, Black/African American; CKD, chronic kidney disease; LIS, Medicare Low-income Subsidy; Part D, Medicare prescription drug coverage benefit. 2017 Annual Data Report Volume 1 CKD, Chapter 7 7
vol 1 Figure 7.3 Sources of prescription drug coverage in Medicare enrollees, by race, 2015 (b) Enrollees with CKD Data source: Medicare 5% sample. Point prevalent Medicare enrollees alive on January 1, 2015. Abbreviations: Blk/Af Am, Black/African American; CKD, chronic kidney disease; LIS, Medicare Low-income Subsidy; Part D, Medicare prescription drug coverage benefit. 2017 Annual Data Report Volume 1 CKD, Chapter 7 8
vol 1 Table 7.3 Medicare Part D enrollees with the Low-income Subsidy, by age & race, 2015 General Medicare (%) Part D with Low-income Subsidy All CKD (%) Part D with Low-income Subsidy White All ages 20-44 45-64 65-74 75+ Black/African American All ages 20-44 45-64 65-74 75+ Asian All ages 20-44 45-64 65-74 75+ Other races All ages 20-44 45-64 65-74 75+ 28.3 92.5 75.5 15.9 20.0 29.7 94.4 76.6 24.4 24.8 65.5 95.0 85.3 46.5 55.5 64.2 95.6 85.0 54.4 60.1 72.6 92.7 84.2 63.6 76.2 77.6 100.0 84.3 71.7 79.0 47.2 93.4 79.5 31.4 43.6 49.2 88.2 79.3 38.9 48.5 Data source: Medicare 5% sample. Point prevalent Medicare enrollees alive on January 1, 2015. Abbreviations: CKD, chronic kidney disease; Part D, Medicare prescription drug coverage benefit. 2017 Annual Data Report Volume 1 CKD, Chapter 7 9
vol 1 Figure 7.4 Distribution of Low-income Subsidy categories in Part D general Medicare and CKD patients, 2015 Data source: Medicare 5% sample. Point prevalent Medicare enrollees alive on January 1, 2015. Abbreviations: CKD, chronic kidney disease; Part D, Medicare prescription drug coverage benefit. 2017 Annual Data Report Volume 1 CKD, Chapter 7 10
vol 1 Table 7.4 Total estimated Medicare Part D spending for fee-for-service beneficiaries (in billions),2011-2015 General Medicare 40.1 35.7 45.7 50.5 54.2 All CKD 5.2 4.8 6.8 7.7 8.7 2011 2012 2013 2014 2015 Data source: Medicare Part D claims. Medicare totals include Part D claims for Part D enrollees with traditional Medicare (Parts A & B). CKD totals include Medicare CKD patients, as determined from claims. Abbreviations: CKD, chronic kidney disease; Part D, Medicare prescription drug coverage benefit. 2017 Annual Data Report Volume 1 CKD, Chapter 7 11
vol 1 Figure 7.5 Per person per year & out-of-pocket costs (in $1,000s) for enrollees, 2015 (a) All enrollees by type of insurance and modality Data source: Medicare Part D claims and Optum Clinformatics claims. Medicare totals include Part D claims for Part D enrollees with traditional Medicare (Parts A & B). CKD totals include Medicare CKD patients as determined from claims. Costs are per person per year for calendar year 2015. Medicare total is the sum of Medicare net payment plus Low-income Supplement amount. Abbreviations: Gen., general enrollees; CKD, chronic kidney disease; Medicare adv., Medicare Advantage plans. 2017 Annual Data Report Volume 1 CKD, Chapter 7 12
vol 1 Figure 7.5 Per person per year & out-of-pocket costs (in $1,000s) for enrollees, 2015 (b) Medicare Part D enrollees by Low-income Subsidy status Data source: Medicare Part D claims and Optum Clinformatics claims. Medicare totals include Part D claims for Part D enrollees with traditional Medicare (Parts A & B). CKD totals include Medicare CKD patients as determined from claims. Costs are per person per year for calendar year 2015. Medicare total is the sum of Medicare net payment plus Low-income Supplement amount. Abbreviations: Gen., general enrollees; CKD, chronic kidney disease; Medicare adv., Medicare Advantage plans. 2017 Annual Data Report Volume 1 CKD, Chapter 7 13
vol 1 Table 7.5 Per person per year spending ($) for enrollees, 2015 Medicare Part D with LIS, General Medicare Part D with LIS, CKD Medicare Part D without LIS, General Medicare Part D without LIS, CKD Medicare Advantage, General Medicare Advantage, CKD Managed care, General Managed care, CKD Age All 5,788 8,145 1,598 2,658 1,760 2,914 971 4,398 20-44 5,613 10,613 2,636 3,020 4,847 9,465 538 2,639 45-64 7,872 12,647 3,790 5,959 4,887 7,564 1,289 4,726 65-74 4,966 8,217 1,527 3,138 1,490 3,367 2,048 5,379 75+ 4,146 5,802 1,450 2,212 1,348 2,206 2,725 3,824 Sex Male 5,877 8,816 1,749 2,891 1,740 2,828 945 4,651 Female 5,727 7,733 1,488 2,427 1,774 2,989 997 4,056 Race White Black/African American Asian 5,988 8,237 1,587 2,586 1,794 2,840 1,004 4,484 5,590 7,947 1,811 3,054 2,567 3,864 916 4,189 4,710 7,467 1,360 2,380 1,855 3,713 554 3,188 Other race 4,861 7,081 1,723 4,525 NA NA NA NA Data source: Medicare Part D claims and Optum Clinformatics year 2015. Medicare PPPY is the sum of Medicare net payment and the Low-income Supplement amount. LIS status is determined from the Part D enrollment. A person is classified as LIS if they are eligible for the LIS for at least one month during 2015. Abbreviations: CKD, chronic kidney disease; Part D, Medicare prescription drug coverage benefit. claims. CKD determined from claims. Costs are per person per year for calendar 2017 Annual Data Report Volume 1 CKD, Chapter 7 14
vol 1 Table 7.6 Top 15 drug classes received by CKD cohorts in different health plans, by percent of patients, 2015 Medicare Part D Medicare Advantage Managed Care Rank Drug class % Drug class % Drug class Renin-angiotensin-aldosterone system inhibitors % Lipid-lowering agents 63.6 Lipid-lowering agents 53.4 51.4 1 Renin-angiotensin-aldosterone system inhibitors Antibacterials 60.5 51.1 Antibacterials 49.5 2 Renin-angiotensin-aldosterone system inhibitors -adrenergic blocking agents Analgesics and antipyretics Diuretics Antiulcer agents and acid suppressants Calcium-channel blocking agents 58.1 Antibacterials 44.8 Lipid-lowering agents 48.0 3 56.0 -adrenergic blocking agents 49.4 Analgesics and antipyretics 48.5 Diuretics 42.4 Calcium-channel blocking agents 39.1 Antidiabetic agents Antiulcer agents and acid Suppressants 36.8 Psychotherapeutic agents 42.9 37.9 36.2 32.5 31.6 Analgesics and antipyretics -adrenergic blocking agents Antidiabetic agents Calcium-channel blocking agents Diuretics 41.7 33.4 32.8 26.8 25.8 4 5 6 7 8 Antidiabetic agents 36.9 30.3 Psychotherapeutic agents 23.1 9 10 Psychotherapeutic agents 26.4 Diabetic consumables* Antiulcer agents and acid suppressants Adrenals Anxiolytics, sedatives, and hypnotics 18.2 Anticonvulsants Thyroid and antithyroid agents 21.8 11 Antithrombotic agents 31.4 Diabetic consumables* 22.7 21.2 12 Anticonvulsants 13 Thyroid and antithyroid agents 14 Anxiolytics, sedatives, and hypnotics 15 Adrenals 26.0 Antithrombotic agents 25.8 Thyroid and antithyroid agents 24.2 Anticonvulsants 21.9 Vaccines 21.8 19.8 18.3 17.4 18.8 15.1 14.8 Data source: Medicare Part D claims and Optum Clinformatics the Medicare 5% sample. Diabetic Consumables refers blood glucose test strips, blood glucose meters/sensors, lancets, needles, pen needles etc. claims. CKD patients with Medicare Part D stand-alone prescription drug plans in 2017 Annual Data Report Volume 1 CKD, Chapter 7 15
vol 1 Table 7.7 Top 15 drug classes received by different CKD cohorts (Medicare Part D/Medicare Advantage programs/managed care health plans), by spending, 2015 (a) Medicare Part D Spending ($ in millions) 1,685.4 Percent of total spending (%) 19.4 Rank Drug class 1 2 3 4 5 6 7 8 9 Antidiabetic agents Antineoplastic agents 994.6 11.4 Antivirals 643.5 7.4 Lipid-lowering agents 437.5 5.0 Psychotherapeutic agents 386.7 4.4 Antithrombotic agents 283.2 3.3 Analgesics and antipyretics 262.3 3.0 Anti-inflammatory agents 255.0 2.9 Antiulcer agents and acid 246.8 2.8 10 11 12 13 14 15 Anticonvulsants 231.1 2.7 Disease-modifying antirheumatic agents 177.8 2.0 Anticholinergic agents 174.5 2.0 Antibacterials 154.0 1.8 Vasodilating agents (respiratory tract) 150.9 1.7 Central nervous system agents, miscellaneous 148.4 1.7 Data source: Medicare Part D claims and Optum Clinformatics drug plans in the Medicare 5% sample. Medicare Part D spending represents the sum of the Medicare covered amount and the Low- income Subsidy amount. Diabetic Consumables refers blood glucose test strips, blood glucose meters/sensors, lancets, needles, pen needles etc. claims. CKD patients with Medicare Part D stand-alone prescription 2017 Annual Data Report Volume 1 CKD, Chapter 7 16
vol 1 Table 7.7 Top 15 drug classes received by different CKD cohorts (Medicare Part D/ Medicare Advantage programs/managed care health plans), by spending, 2015 (b) Medicare Advantage Spending ($ in millions) 109.2 Percent of total spending 17.7 Rank Drug class 1 2 3 4 5 6 7 8 9 Antidiabetic agents Antineoplastic agents 63.3 10.3 Lipid-lowering agents 46.7 7.6 Antivirals 32.9 5.3 Diabetes consumables* 30.1 4.9 Psychotherapeutic agents 23.8 3.9 Antithrombotic agents 23.0 3.7 Analgesics and antipyretics 18.8 3.0 Anti-inflammatory agents Renin-angiotensin-aldosterone system inhibitors Antiulcer agents and acid 18.7 3.0 10 15.9 2.6 11 12 13 14 15 15.3 2.5 Anticonvulsants 14.8 2.4 Anticholinergic agents 11.9 1.9 Calcium-channel blocking agents 10.0 1.6 -adrenergic blocking agents 9.4 1.5 Data source: Medicare Part D claims and Optum Clinformatics the Medicare 5% sample. Medicare Part D spending represents the sum of the Medicare covered amount and the Low- income Subsidy amount. Diabetic Consumables refers blood glucose test strips, blood glucose meters/sensors, lancets, needles, pen needles etc. claims. CKD patients with Medicare Part D stand-alone prescription drug plans in 2017 Annual Data Report Volume 1 CKD, Chapter 7 17
vol 1 Table 7.7 Top 15 drug classes received by different CKD cohorts (Medicare Part D/ Medicare Advantage programs/managed care health plans), by spending, 2015 (c) Managed Care Spending ($ in millions) 49.1 Percent of total spending 21.9 Rank Drug class 1 2 3 4 5 6 7 8 9 Antidiabetic agents Antineoplastic agents 32.5 14.5 Antivirals 18.4 8.2 Lipid-lowering agents 13.4 6.0 Disease-modifying antirheumatic agents 8.7 3.9 Analgesics and antipyretics 7.9 3.5 Antithrombotic agents 6.8 3.1 Psychotherapeutic agents 6.5 2.9 Diabetic consumables* Renin-angiotensin-aldosterone system inhibitors Anti-inflammatory agents 6.2 2.8 10 4.3 1.9 11 12 13 14 15 3.7 1.6 Anticonvulsants 3.6 1.6 Antibacterials 3.3 1.5 Immunosuppressive agents 3.1 1.4 Immunomodulatory agents 2.8 1.3 Data source: Medicare Part D claims and Optum Clinformatics plans in the Medicare 5% sample. Medicare Part D spending represents the sum of the Medicare covered amount and the Low- income Subsidy amount. Diabetic Consumables refers blood glucose test strips, blood glucose meters/sensors, lancets, needles, pen needles etc. claims. CKD patients with Medicare Part D stand-alone prescription drug 2017 Annual Data Report Volume 1 CKD, Chapter 7 18
vol 1 Figure 7.6 Estimated utilization rate of prescription NSAIDs, by state, Medicare CKD Patients, 2015 Data source: Medicare Part D claims. CKD patients with Medicare Part D stand-alone prescription drug plans in the Medicare 5% sample. Abbreviations: NSAIDs, nonsteroidal anti-inflammatory agents. NSAID filled under Medicare Part D represent a fraction of actual NSAID use. 2017 Annual Data Report Volume 1 CKD, Chapter 7 19
vol 1 Figure 7.7 Estimated utilization rate of opioid analgesics, by state, Medicare CKD Patients, 2015 Data source: Medicare Part D claims. CKD patients with Medicare Part D stand-alone prescription drug plans in the Medicare 5% sample. 2017 Annual Data Report Volume 1 CKD, Chapter 7 20


 for")