Economic Review and Outlook 2011: Global Trends and Regional Impacts
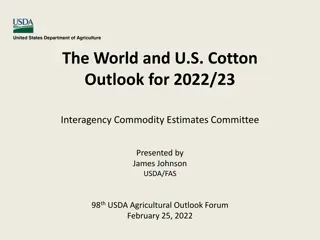
The Provincial Economic Review and Outlook for 2011 highlighted the global economic performance and outlook, focusing on factors like GDP growth, employment trends, and socio-economic conditions in the Western Cape region. It discussed the recovery in global economic growth post-2009, with the IMF projecting a 4% growth for both 2011 and 2012. Risks to the global outlook included fiscal sustainability issues in the US and Europe, high unemployment rates, and the potential for an oil price spike. The presentation also touched on South Africa's economic growth in 2010, emphasizing the fluctuations in GDP growth rates throughout the year.

Download Presentation

Please find below an Image/Link to download the presentation.
The content on the website is provided AS IS for your information and personal use only. It may not be sold, licensed, or shared on other websites without obtaining consent from the author. Download presentation by click this link. If you encounter any issues during the download, it is possible that the publisher has removed the file from their server.
E N D
Presentation Transcript
Provincial Economic Review and Outlook 2011 Presented by: Bongi Mamba Presented at the Annual Congress of the 3rdPublic Sector Economists Forum Date: 30 November 2011
Focus of the Presentation Recent Global, National & WC economic performance and outlook Economic structure and growth of the WC economy (output and employment growth and performance of sectors The dynamics of the Western Cape labour market A review of the WC socio-economic conditions 2
Global economic performance and outlook After declining during 2009, global economic growth recovered robustly to 5.1 per cent during 2010. Economic growth remained strong in the first quarter of 2011, but global economic conditions have since deteriorated The International Monetary Fund (IMF) expects global output to grow by 4 per cent in both 2011 and 2012 (down from 4.3 and 4.5 per cent forecasted in June 2011). For the US, the forecast for economic growth has been revised to 1.5 per cent in 2011 (1 percentage point lower than in June) and 1.8 per cent in 2012. The Euro area has also been downwardly adjusted to 1.6 and 1.1 per cent for 2011 and 2012 (from 2.0 and 1.7 per cent previously). The risks to global economic recovery remain ongoing fiscal difficulties in the US and Europe and high levels of unemployment in the former. 3
Risks to the global outlook The key risk factor remains the fiscal sustainability of the US and parts of Europe, which should weigh on growth in those economies directly and on the global economy indirectly The need for US fiscal consolidation has become more pronounced after Standard & Poor s downgrade of US debt following a political standoff between the Democrats and the Republicans, which led to an 11thhour decision to raise the US debt ceiling The European debt situation remains fundamental as Greece and others are forced to adhere to strict austerity measures in order to continuously access IMF/EU funding Unemployment still remains high at 9.1 per cent and remains a concern. An improved job market in countries like the US is crucial if private demand is to counter the expected negative government contribution in 2012/13 as US fiscal policy starts to tighten. The global economy remains at risk of a renewed oil price spike. 4
Developments in the SA Economy Economic activity in SA registered growth of 2.8 per cent in 2010, following the decline of 1.7 per cent in 2009 GDP growth started strongly in 2010, with economic activity rising by 4.8 per cent in the first quarter of 2010 However, the middle part of the year saw a more modest pace of growth (around 2.8 per cent). The fourth quarter of 2010 again registered a robust rate of economic growth of 4.5 per cent. The biggest contributors were manufacturing (contributing 0.7 percentage points), followed by the finance, real estate and business services as well as the government sectors (each contributing 0.4 percentage points). Real consumer spending increased by an annual rate of 4.9 per cent during the second quarter of 2011, largely unchanged from the 5 per cent in the first quarter of 2011 Overall real fixed investment increased by 1 per cent q-o-q, which resulted in the year-on-year growth rate of 2.4 per cent, from 1.7 per cent during the first quarter of 2011. 5
Outlook for SA economy The July PMI points towards continued strain on manufacturing production beyond the second quarter of 2011 National Treasury expects economic growth to accelerate to 3.1 per cent in 2011 and 3.4 and 4.1 per cent in 2012 and 2013 respectively. In contrast to the National Treasury, BER expects growth to moderate to 2.8 per cent in 2012 before picking up to 3.6 per cent in 2013. Headline SA consumer inflation remains on an upward trend, rising to 5.7 per cent year-on-year in September 2011 the highest level since early 2010 The National Treasury expects CPI inflation to average 5 per cent in 2011 and to be slightly higher in 2012 at 5.4 per cent 6
Developments in the Western Cape Economy Historically, the Western Cape economy has outperformed the national economy in terms of economic growth - finance, insurance, real estate and business services as well as the transport, storage and communication sectors Western Cape economy, economic activity in the Western Cape declined by 1.4 per cent in 2009, which was slightly lower than the 1.5 per cent contraction registered by the national economy (at basic prices). Regional GDP in the Western Cape grew at an average of 4.3 per cent per an However, this average was pulled down by the 1.4 per cent contraction in economic activity registered in 2009 7
Western Cape GDP per sector: 2005 - 2010 5-year average growth (2005 2009) % contribution to GDP, 2009 Description 2005 2006 2007 2008 2009 2010 Agriculture, forestry & fishing 5.9 -5.7 1.6 17.7 -5.5 0.7 2.8 4.0 Mining & quarrying 5.2 -5.6 0.9 -7.1 0.5 -8.8 -1.2 0.2 Manufacturing 5.3 6.3 5.2 2.1 -8.9 3.9 2 16.9 Electricity, gas & water 6.0 2.0 2.4 -3.8 0.5 3.2 1.4 1.5 Construction 12.3 10.7 15.1 8.2 6.1 1.6 10.5 4.7 Wholesale & retail trade, catering & accommodation 9.2 5.2 5.4 0.1 -2.8 2.6 3.4 14.6 Transport, storage & communication 9.0 4.2 7.0 2.3 0.7 3.0 4.6 10.1 Finance, insurance, real estate & business services 4.4 9.4 8.2 7.5 0.5 1.9 6.0 32.5 Community, social & personal services 4.3 4.3 5.4 4.1 -0.5 0.6 3.5 5.3 General government 3.9 2.6 4.0 4.2 3.9 2.4 3.7 10.1 Total 6.1 5.9 6.4 4.5 -1.4 2.4 4.3 100.0 8
Outlook for the Western Cape Economy 5 year average growth Description 2011 2012 2013 2014 2015 Agriculture, forestry & fishing 3.1 2.0 2.7 3.3 3.5 2.9 Mining & quarrying 4.4 1.0 0.9 1.1 1.1 1.7 Manufacturing 3.5 3.5 3.5 3.6 3.4 3.5 Electricity, gas & water 1.3 3.3 3.2 3.3 3.2 2.9 Construction 2.1 5.0 6.2 6.5 6.7 5.3 Wholesale & retail trade, catering & accommodation 4.2 3.7 4.1 4.0 4.0 4.0 Transport, storage & communication 5.3 5.4 5.8 5.8 5.5 5.6 Finance, insurance, real estate & business services 4.5 5.0 4.8 5.1 5.2 4.9 Community, social & personal services 3.2 2.8 3.0 3.0 3.1 3.0 General government 2.2 2.3 2.4 2.0 2.0 2.2 Total 3.9 4.1 4.2 4.3 4.3 4.2 9
Western Cape real GDPR growth across 9 broad sectors: 2000 - 2010 220 210 200 190 TOTAL 180 Construction 170 Finance & business services index 2000=100 160 Transport & Communication 150 Internal trade 140 Electricity 130 Govt & CSP services 120 Agric 110 Manufacturing 100 Mining 90 80 70 2000 2001 2002 2003 2004 2005 2006 2007 2008 2009 2010 10
Western Cape: Real GDPR growth vs. Employment growth There seems to be a link between the historical growth pattern and the structural imbalance in the Western Cape economy, specifically a mismatch between output and employment growth. The real economy expanded by close to 45% between 2001 and 2010, the regional workforce only grew by close to 16% over this period. 11
Western Cape sector outlook for real GDPR growth, 2011 - 2015 12
Real export growth: WC vs Rest of RSA, 2000- 2010 13
Composition of Western Cape exports: average, 2005 - 2010 Western Cape exports are dominated by the agricultural, forestry and fishing and food and beverage sectors, i.e. the food value chain. In all, these two subsectors accounted for approximately 37% of exports on average during 2005 to 2010. 14
Western Cape real export growth: 2011 - 2015 Average annual real growth % share 2005 - 2010 Sector 2000 - 2007 2008 - 2010 2011 - 2015F Agriculture, forestry and fishing 18.3 18.3 15.4 3.3 Mining 1.0 1.9 -1.2 2.4 Food, beverages and tobacco 18.5 3.7 -4.4 5.0 Textiles, clothing and leather goods 2.0 -8.5 -24.8 2.0 Wood and paper; publishing and printing 1.1 -1.8 -13.4 2.9 Petro products, chem, rubber & plastic 9.8 7.1 -13.6 9.7 Other non-metal mineral products 0.3 -0.3 -18.1 3.2 Metals, metal prod, mach & equipment 10.5 15.5 -4.8 9.6 Electrical machinery and apparatus 0.4 -1.8 -10.3 4.2 Radio, TV, instruments, watches & clocks 2.6 16.7 -13.4 14.5 Transport equipment 3.1 5.9 -16.0 10.4 Furniture; other manufacturing 4.1 16.3 -17.9 2.4 Electricity 0.1 4.7 -5.1 7.3 Construction 0.0 3.3 -12.4 4.4 Wholesale & retail trade 5.7 5.6 -6.2 5.0 Catering and accommodation 2.9 6.6 -4.5 5.2 Transport 6.1 6.0 -5.5 5.9 Communication 2.8 21.1 5.9 7.6 Finance and insurance 4.8 6.9 -3.6 3.1 Business services 4.7 15.6 4.1 8.7 Community, social and personal services 1.0 13.0 2.7 4.6 Total 15 100 6.8 -3.6 6.0
Overview of the Western Cape labour market, 2011 Narrow Labour Force Partici- pation Rate Narrow Unem- ployment Rate Working Age Population Employed Narrow Unemployed Narrow Labour Force Share (%) Total ( 000s) Share (%) Total ( 000s) Share (%) Total ( 000s) Share (%) Total ( 000s) (%) (%) Total By Race African Coloured White By Gender Male Female By Age Group 15 - 24 years 25 - 34 years 35 - 44 years 45 - 54 years 55 - 65 years By Education No education Grades 0 - 7 Grades 8 - 11 Grade 12 Dipl/Cert Degree 1 789 100.0 2 300 100.0 3 450 100.0 510 100.0 66.7 22.2 466 958 355 26.1 53.5 19.8 687 1 226 376 29.9 53.3 16.4 984 1 884 568 28.5 54.6 16.5 221 268 21 43.2 52.6 4.2 69.8 65.1 66.2 32.1 21.9 5.6 975 815 54.5 45.5 1 232 1 068 53.6 46.4 1 678 1 772 48.6 51.4 258 253 50.5 49.5 73.4 60.2 20.9 23.7 196 604 522 339 128 10.9 33.7 29.2 19.0 7.2 363 804 620 376 136 15.8 35.0 27.0 16.3 5.9 882 957 743 520 348 25.6 27.7 21.5 15.1 10.1 168 200 98 36 32.8 39.2 19.3 7.1 1.6 41.2 84.0 83.5 72.2 39.2 46.2 24.9 15.8 9.7 5.9 8 18 1.0 10.9 33.6 30.5 13.1 9.2 19 0.8 11.9 37.8 29.6 10.9 7.5 44 479 1 447 931 292 198 1.3 13.9 41.9 27.0 8.5 5.7 1 0.1 15.8 52.5 26.4 3.0 1.7 43.5 57.3 60.0 73.0 85.5 87.7 3.9 29.3 30.8 19.8 6.2 4.9 194 601 545 234 165 275 869 680 250 173 81 268 135 15 8 16
Recent Labour Market Trends, 2010Q3 to 2011Q3 Change 2010Q3 2010Q4 2011Q1 2011Q2 2011Q3 Absolute Relative Western Cape Aggregates (Thousands) Working Age Population Employment Narrow Unemployed Narrow Labour Force Broad Unemployed Broad Labour Force Discouraged Workseekers Rates (per cent) Narrow Unemployment Broad Unemployment Narrow LFPR Broad LFPR South Africa Aggregates (Thousands) Working Age Population Employment Narrow Unemployed Narrow Labour Force Broad Unemployed Broad Labour Force Discouraged Workseekers Rates (per cent) Narrow Unemployment Broad Unemployment Narrow LFPR Broad LFPR 3 390 1 754 527 2 281 565 2 319 38 3 403 1 772 498 2 271 522 2 294 24 3 417 1 784 510 2 295 529 2 313 19 3 430 1 805 504 2 309 538 2 343 34 3 444 1 806 550 2 356 580 2 386 30 54 52 23 75 15 67 -8 1.6 3.0 4.4 3.3 2.7 2.9 -21.1 23.1 24.4 67.3 68.4 21.9 22.8 66.7 67.4 22.2 22.9 67.2 67.7 21.8 23.0 67.3 68.3 23.3 24.3 68.4 69.3 0.2 percentage points -0.1 percentage points 1.1 percentage points 0.9 percentage points 32 072 12 975 4 396 17 371 6 429 19 404 2 033 32 193 13 132 4 137 17 269 6 287 19 419 2 150 32 314 13 118 4 364 17 482 6 587 19 705 2 223 32 435 13 125 4 538 17 663 6 745 19 870 2 207 32 555 13 318 4 442 17 760 6 646 19 964 2 204 483 343 46 389 217 560 171 1.5 2.6 1.0 2.2 3.4 2.9 8.4 25.3 33.1 54.2 60.5 24.0 32.4 53.6 60.3 25.0 33.4 54.1 61.0 25.7 33.9 54.5 61.3 25.0 33.3 54.6 61.3 -0.3 percentage points 0.2 percentage points 0.4 percentage points 0.8 percentage points 17
Industrial composition of formal employment Western Cape South Africa Per cent Share Per cent Share Thousands Thousands Total Formal Employment 1 485 100.0 9 743 100.0 Agriculture, forestry and fishing 115 7.8 509 5.2 Mining and quarrying 2 0.2 306 3.1 * Primary Sector 118 7.9 815 8.4 Manufacturing 270 18.2 1 586 16.3 Electricity, gas and water 11 0.7 96 1.0 Construction 95 6.4 741 7.6 Secondary Sector 376 25.3 2 422 24.9 Wholesale and retail trade 306 20.6 1 941 19.9 Transport, storage and communication 94 6.3 536 5.5 Financial and business services 221 14.9 1 508 15.5 Community, social and personal (CSP) services 369 24.8 2 516 25.8 Tertiary Sector 991 66.7 6 501 66.7 18
Demographic characteristics of formal employment, 2011 Western Cape South Africa Per cent Share Per cent Share Thousands Thousands Total Formal Employment By Race African Coloured White By Gender Male Female By Age Group 15 to 24 year olds 25 to 34 year olds 35 to 44 year olds 45 to 54 year olds 55 to 65 year olds By Educational Attainment No education Grades 0 7 Grades 8 11 Grade 12 Diploma/Certificate Degree 1 485 100.0 9 743 100.0 333 816 326 22.4 54.9 21.9 6 150 1 252 1 897 63.1 * 12.8 * 19.5 838 648 56.4 43.6 5 850 3 893 60.0 * 40.0 * 165 510 429 276 106 11.1 34.3 28.9 18.6 7.1 950 3 259 2 884 1 826 824 9.8 33.4 29.6 18.7 8.5 11 128 461 482 221 157 0.7 8.6 31.1 32.4 14.9 10.5 146 833 2 752 3 330 1 565 1 009 1.5 * 8.6 28.2 34.2 16.1 10.4 19
Demographic composition of informal sector employment, 2011 Western Cape South Africa Per cent Share 100.0 Per cent Share 100.0 Thousands Thousands Total Informal Sector Employment By Race African Coloured White By Gender Male Female By Age Group 15 to 24 year olds 25 to 34 year olds 35 to 44 year olds 45 to 54 year olds 55 to 65 year olds By Educational Attainment No education Grades 0 7 Grades 8 11 Grade 12 Diploma/Certificate Degree 198 2 281 83 88 27 41.8 44.6 13.5 1 990 160 92 87.2 * 7.0 * 4.1 * 123 75 62.3 37.7 1 343 938 58.9 41.1 12.0 34.5 27.4 17.5 8.6 4.8 * 20.6 44.7 22.3 4.8 1.6 23 73 57 32 12 11.8 37.1 29.1 16.0 6.0 273 787 625 398 197 4 1.8 14.3 46.5 25.4 6.1 4.2 109 470 1 021 508 109 36 28 92 50 12 8 20
Selected indicators of living standards within the Western Cape by region Cape Wine- lands West Coast Over- berg Central Karoo Cape Town Eden Total Population Population share Black share Coloured share Indian/Asian share White share Labour force Share of labour force Narrow unemploy- ment rate Average per capita income (Rand) Median per capita income (Rand) Poverty head-count ratio Gini coefficient 282 023 5.39% 9.0% 71.6% 0.3% 19.2% 127 717 5.26% 15.6% 706 192 13.59% 20.5% 65.1% 0.5% 14.0% 317 839 13.08% 16.2% 209 981 4.09% 20.0% 59.6% 0.3% 20.1% 95 242 3.92% 17.8% 506 514 9.69% 29.0% 52.2% 0.5% 18.4% 225 904 9.30% 18.5% 54 477 1.09% 9.6% 80.4% 0.1% 9.9% 19 971 0.82% 30.9% 3 469 467 66.39% 34.9% 44.0% 1.8% 19.4% 1 642 934 67.62% 24.5% 5 228 654 100% 30.1% 50.1% 1.3% 18.5% 2 429 607 100% 22.2% 27 797 24 737 27 591 25 986 17 985 40 071 35 296 10 861 10 182 10 182 9 051 6 711 13 576 11 451 21.3% 21.0% 25.9% 29.1% 39.1% 23.7% 24.0% 0.645 0.634 0.66 0.685 0.678 0.699 0.694 21
Educational attainment of the South African adult population (20 years or more) by province, 2007 Mean years of education of adults Number with matric or more (incl. degrees) As % of adult population Number with degrees Province Degrees Matric Western Cape 9.62 41 190 1 098 013 1.10 29.20 Eastern Cape 8.00 11 166 649 703 0.28 16.27 Northern Cape 8.03 2 031 150 426 0.28 21.04 Free State 8.44 8 326 409 025 0.44 21.57 kwaZulu-Natal 8.46 23 991 1 557 825 0.37 23.88 North West 7.88 6 376 433 781 0.29 19.74 Gauteng 9.91 83 531 2 651 424 1.10 34.99 Mpumalanga 8.16 5 956 512 524 0.26 22.10 Limpopo 7.70 6 879 518 855 0.22 16.56 South Africa 8.73 189 446 7 981 576 0.59 24.85 22
Western Cape infant and under 5 mortality rates, 2007 and 2008, and TB incidence by region, 2010 TB Infant mortality rate (child deaths before age 1 per 1 000 babies born) Under 5 mortality rate (child deaths before age 5 per 1 000 babies born) incidence per 100 000 population Region 2007 2008 2007 2008 2010 Cape Winelands 26.4 20.5 31.3 27.0 1 011.6 Central Karoo 44.4 44.3 59.3 58.8 1 018.2 Overberg 32.4 24.7 40.1 30.9 1 051.5 Eden 29.0 21.9 35.1 27.4 981.3 West Coast 35.7 30.8 41.7 36.9 1 271.3 Cape Town metro 25.9 24.5 31.4 30.2 800.2 Western Cape 27.3 24.2 33.0 30.2 884.9 Western Cape (ASSA 2008 estimates) 25.88 23.68 34.53 30.87 23
Transfers-in from outside the Province as a percentage of those in each grade, Western Cape 2010 7% 5.97% 6% 5% 4.48% 3.74% 4% 2.72% 3% 2.63% 2.40% 2.26% 2.19% 2.16% 2.08% 1.99% 2% 1% 0.26% 0% Grade 1 Grade 2 Grade 3 Grade 4 Grade 5 Grade 6 Grade 7 Grade 8 Grade 9 Grade 10 Grade 11 Grade 12 24
Municipal Housing Backlog Estimate 2010 25 000 19 687 20 000 17 144 15 000 10 466 10 460 9 476 7 907 9 142 9 008 10 000 8 116 6 453 3 948 5 342 4 986 4 118 2 244 4 420 3 720 1 995 5 000 2 192 1 561 1276 1 200 821 303 0 Beaufort West Mossel Bay Oudtshoorn Drakenstein Bergrivier Prince Albert Theewaterskloof Hessequa Matzikama Cederberg George Knysna Witzenberg Laingsburg Cape Agulhas Bitou Overstrand Swellendam Breede Valley Stellenbosch Swartland Kannaland Langeberg Saldanha Bay 25
Percentage of households with access to four main municipal services, 2007 - 2009 and with all four services, 2001, 2007 and 2007 - 2009 With all 4 services Sanita- tion 2007- 2009 Refuse removal 2007- 2009 Water 2007- 2009 Fuel 2007- 2009 GHS 2007- 2009 Census 2001 CS 2007 District Municipalities West Coast 97.1 95.3 95.4 72.3 60.7 79.2 67.7 Cape Winelands 86.7 96.2 89.8 78.8 60.3 65.1 68.6 Overberg 87.8 95.5 90.7 82.0 62.7 82.4 71.9 Eden 92.8 92.4 94.0 90.9 68.8 79.2 83.3 Central Karoo 98.7 88.9 93.5 76.2 72.5 84.0 74.0 City of Cape Town: Metro 91.8 93.8 95.3 95.0 79.7 86.7 88.3 Western Cape 91.3 93.9 94.3 90.5 74.0 82.6 83.3 Durban: Ethekwini Municipality 82.0 72.1 90.9 81.4 55.9 62.8 62.8 City of Johannesburg 92.7 91.0 89.3 91.4 74.2 80.8 83.0 Pretoria: City of Tshwane 89.1 80.2 90.5 80.6 62.2 63.5 73.5 South Africa 70.4 59.8 83.1 58.7 41.7 49.1 50.2 26
Drug-related crime and Driving under the influence of alcohol or drugs in the Western Cape in a South African context between 2007 and 2011 Reported cases 2007/08 2008/09 2009/10 2010/11 Drug-related crime: WC Drug-related crime: RSA 45 985 109 134 52 781 117 172 60 409 134 840 70 588 150 673 Percentage share: WC 42.14 45.05 44.80 46.85 Driving under the influence of alcohol or drugs: WC Driving under the influence of alcohol or drugs: RSA 11 616 48 405 12 741 56 165 15 644 62 939 17 244 66 697 Percentage share: WC 24.00 22.68 24.86 25.85 27
Conclusion The outlook for the global economy suggests that the recovery should continue in 2011 and 2012. However, recent economic have not been supportive of economic growth. Agriculture and its associated processing industries are by far the largest contributor to Western Cape exports. Employment remains stagnant, having changed little between 2008 and 2011. Coloureds account for 53 per cent of employment, with Africans and Whites accounting for 30 per cent and 16 per cent, respectively The City of Cape Town dominates not only the economy but also the population of the Western Cape. Two-thirds of the population reside within the Cape Town Metropolitan area, while many more commute to work in the City on a daily basis. Generally, socio-economic conditions in the Western Cape are better than in other provinces, although Gauteng has a somewhat higher educational attainment. 28
THANK YOU THANK YOU 29