Global Cotton Outlook 2022/23: Consumption Recovery, Production Growth, and Price Trends
The USDA's Interagency Commodity Estimates Committee presented the global cotton outlook for 2022/23, highlighting a continued consumption recovery, a rise in production to the highest level in 11 years, and a dip in global stocks leading to price retreats. The report discusses the factors influencing the cotton market, including macro and trade policy uncertainty, and includes insights on specific regions like China, India, Turkey, and the United States. Various charts and data visualizations provide a detailed overview of the current and projected trends in global cotton production and consumption.

Download Presentation

Please find below an Image/Link to download the presentation.
The content on the website is provided AS IS for your information and personal use only. It may not be sold, licensed, or shared on other websites without obtaining consent from the author. Download presentation by click this link. If you encounter any issues during the download, it is possible that the publisher has removed the file from their server.
E N D
Presentation Transcript
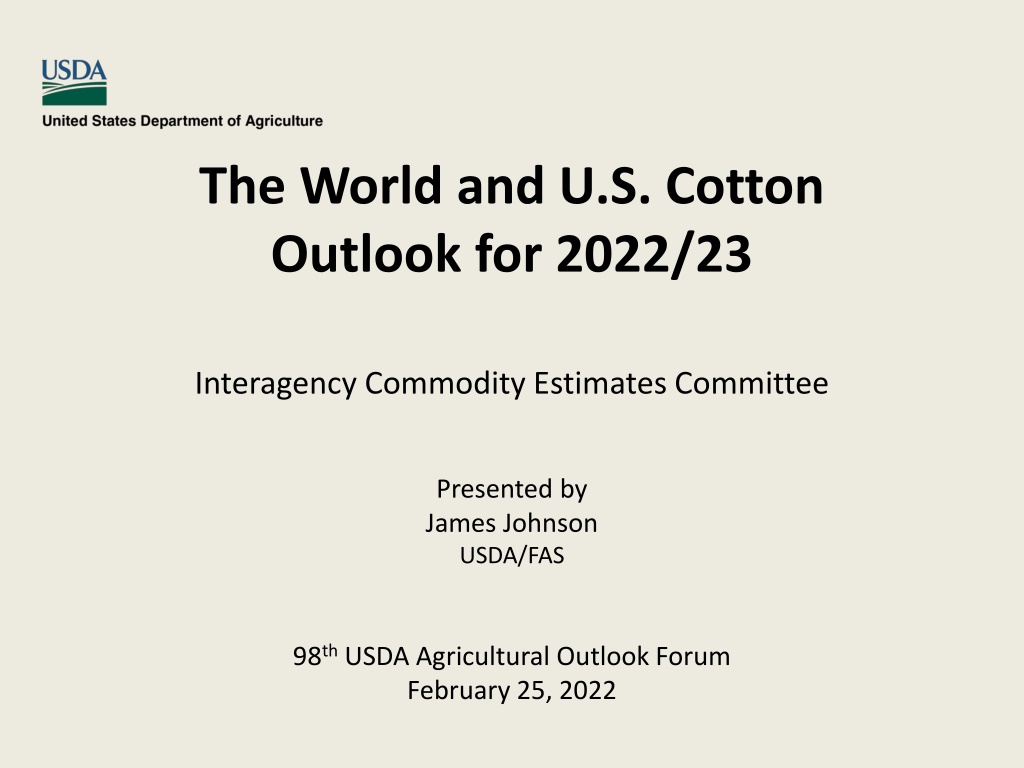
The World and U.S. Cotton Outlook for 2022/23 Interagency Commodity Estimates Committee Presented by James Johnson USDA/FAS 98thUSDA Agricultural Outlook Forum February 25, 2022
USDA Global Cotton Outlook Highlights 2021/22 Review: World consumption continues recovery to a record level Production recovers from 2020/21 low World trade down from 2020/21 record China s reserve stocks largely stable A-Index up 47 % yty, averaging 125 cents 2
USDA Global Cotton Outlook Highlights 2022/23 Outlook: Global consumption continues recovery (1.7% growth) World production rises to highest level in 11 years, helped by recent price strength Global stocks dip, prices retreat from historic highs Macro and trade policy uncertainty 3
World Prices Soar, Consumption Continues to Grow Production Consumption A-Index Mil. Bales Cents/lb. 140 140 120 120 100 100 80 80 60 60 40 40 20 20 0 0 2015/16 2016/17 2017/18 2018/19 2019/20 2020/21 2021/22 Sources: USDA, Interagency Commodity Estimates Committee and Cotlook. 5
Global Cotton Production Changes in 2021/22: Million Bales 4.0 3.0 3.0 2.7 2.4 2.0 1.4 1.3 0.9 1.0 0.0 -0.6 -1.0 -2.0 -2.5 -3.0 China India Turkey Pakistan FrZn Brazil Australia United States Source: USDA, Interagency Commodity Estimates Committee. 6
Cotton Consumption Recovery Continues Cotton consumption estimated at 124 million bales. Above average (2.8%) increase Record level, higher than pre-global economic crisis level Led by gains in India and Turkey Pipeline filling 7
China Consumption Slips Million Bales 45 40 35 30 25 41.0 20 40.0 39.5 39.5 38.5 33.0 15 10 5 - 2016/2017 2017/2018 2018/2019 2019/2020 2020/2021 2021/2022 est. Marketing year Source: USDA 8
China Cotton Supply and Demand 2020/21 and 2021/22 Attribute Unit 2020/21 2021/22 Change (%) Beginning Stocks Area Harvested Production Imports Total Supply Exports Use Total Use Ending Stocks State Reserve Stock to Use % mil. bales mil. HA mil. bales " " " " " " " % 36.9 3.3 29.5 12.9 79.3 0.0 40.0 40.0 39.3 10.5 98.1 39.3 3.1 27.0 9.5 75.8 0.1 39.5 39.6 36.2 9.5 91.4 6.4 -4.6 -8.5 -26.1 -4.4 n/a -1.3 -1.1 -7.8 -9.5 -6.7 9
Global Cotton Stocks Down Y-O-Y Stocks (Less China) decline for second year 120 China ROW U.S. 100 Slightly lower stocks (outside of China) 80 Million bales 60 40 20 Estimated level remains high 0 2014/15 2015/16 2016/17 2017/18 2018/19 2019/20 2020/21 2021/22 est. Source: USDA, Interagency Commodity Estimates Committee. 10
China Ending Stocks Down, Both Reserve and Free Stocks Mil. Bales % 60 200.0 50 150.0 40 30 100.0 20 50.0 10 0 0.0 2015/16 2016/17 2017/18 2018/19 2019/20 2020/21 2021/22 est. Other Stocks State Reserve Stocks-to-use Sources: USDA 11
U.S. Cotton Supply & Demand Estimates: Production, Ending Stocks Higher; Exports Lower Attribute Unit 2020/21 2021/22 Change (%) Beginning Stocks Area Harvested Production Imports Total Supply Exports Use Total Use Ending Stocks Stock to Use % Farm Price mil. bales mil. HA mil. bales " " " " " " % cents/lb. 7.3 3.3 14.6 0.0 21.9 16.4 2.4 18.8 3.2 16.8 66.3 3.2 4.0 17.6 0.0 20.8 14.8 2.6 17.3 3.5 20.2 90.0 -56.6 20.5 20.6 0.0 -4.9 -9.9 6.3 -7.8 11.1 3.4 35.7 Source: USDA, Interagency Commodity Estimates Committee. 14
U.S. Cotton Export Seasonality Altered U.S. cotton weekly exports: actual MY16-21 and projected 700 COVID-19 Impacts Start 600 500 Thous. 480lb bales 400 300 200 100 0 Aug-16 Nov-16 Feb-17 Aug-17 Nov-17 Feb-18 Aug-18 Nov-18 Feb-19 Aug-19 Nov-19 Feb-20 Aug-20 Nov-20 Feb-21 Aug-21 Nov-21 Feb-22 Aug-22 May-17 May-18 May-19 May-20 May-21 May-22 Projected +/-1sd +/-2sd Actual (480lb) Data Source: U.S. Export Sales 15
U.S. Cotton Export Seasonality Altered U.S. cotton weekly MY20 exports: actual and projected U.S. cotton weekly MY21 exports: actual and projected 600 600 500 500 Assume 14.75 MB US PSD EX and average seasonality Thousand 480lb bales 400 400 Thousand 480lb bales 300 300 200 200 Assume 16.4 MB US EX and average seasonality 100 100 0 0 Projected +/-1sd +/-2sd Actual (480lb) Projected +/-1sd +/-2sd Actual (480lb) Needed to meet forecast Onset of global pandemic was negative shock to U.S. cotton exports during the latter half of marketing year 2019/20 Early season U.S. cotton exports were elevated from normal seasonal pattern in marketing year 2020/21 Data Source: U.S. Export Sales 16
USDAs 2022/23Outlook Continuation of current policy Normal weather assumed World GDP growth remains favorable (4.4% and 3.8% vs average 3.4%) Global consumption growth continues, near long-term average Higher China imports(State Reserve s role) Production rises in response to price surge in 2021/22 World and U.S. cotton prices fall back from very high levels 18
Higher World Cotton Consumption Forecast for 2022/23 Global consumption projected at 126.5 M bales Up from 2021/22 record level Global consumption growth near long-term average GDP growth above long term averages Concerns about inflation and logistics issues China s consumption growth at less than 2% Remains largest global cotton fiber consumer Apparel production for export shifting elsewhere Domestic consumer market increases share 19
World Cotton Consumption Often Follows Economic Growth Percent change, cotton Percent change, GDP 15 8 7 Cotton GDP 10 6 5 5 4 0 3 1980 1985 1990 1995 2000 2005 2010 2015 2020 2 -5 1 0 -10 -1 -15 -2 Sources: USDA and International Monetary Fund (IMF). 20
Cotton/Polyester Price Ratio 2.6 2.2 Fiber price ratio 1.8 1.4 1.0 0.6 2005 2010 2015 2020 A Index/polyester Linear (A Index/polyester) Source: USDA calculations based on data from Cotlook Ltd., Cncotton, National Cotton Council, and International Cotton Advisory Committee. 21
Higher World Cotton Consumption Forecast for 2022/23 Consumption outside China: Mexico, Turkey, and Pakistan expand use (once again) Growth in India, Vietnam, and Bangladesh Cotton s projected share of world fiber market potentially at risk with high price relative to MMF 22
Global Production Projected Higher in 2022/23: Harvested area gains in some countries Million bale change 1.5 China and India Higher 1 0.5 0 Harvested area rises in U.S., Turkey, and Pakistan -0.5 -1 Australia Brazil Cen. Asia Greece Turkey United States Pakistan China India Source: USDA, Interagency Commodity Estimates Committee. 23
World Cotton Supply & Demand Projections: Consumption Exceeds Production, Stocks Dip; Trade Up Attribute Unit 2021/22 2022/23 Change (%) Beginning Stocks Area Harvested Production Imports Total Supply Exports Use Total Use Ending Stocks Stock to Use % mil. bales mil. HA mil. bales " " " " " " % 88.7 32.3 120.2 46.4 208.8 46.4 124.4 124.5 84.3 67.8 84.3 33.6 124.0 48.5 208.3 48.5 126.5 126.6 81.7 64.6 -4.9 4.2 3.2 4.4 -0.2 4.4 1.7 1.7 -3.1 -3.2 Source: USDA, Interagency Commodity Estimates Committee. 24
Global Cotton Stocks Projected Slightly Lower and world prices fall Million bales Cents/lb. Rest of World China A Index 125.0 120 130 120 100 110 80 100 60 90 80 40 70 20 60 0 50 2016/17 2017/18 2018/19 2019/20 2020/21 2021/22 est. 2022/23 proj Marketing year Source: USDA, Interagency Commodity Estimates Committee. 25
China Cotton Supply & Demand Projections: Consumption Growth Slows, Imports Steady, Stocks Lower Attribute Unit 2021/22 2022/23 Change (%) Beginning Stocks Area Harvested Production Imports Total Supply Exports Use Total Use Ending Stocks State Reserve Stock to Use % mil. bales mil. HA mil. bales " " " " " " " % 39.3 3.1 27.0 9.5 75.8 0.1 39.5 39.6 36.2 9.5 91.4 36.2 3.1 28.0 11.0 75.2 0.1 40.0 40.1 35.1 10.5 87.5 -7.8 0.0 3.7 15.8 -0.8 0.0 1.3 1.3 -3.0 10.5 -3.9 Source: USDA, Interagency Commodity Estimates Committee. 26
Chinas State Cotton Reserves: SR stocks continue steady Million Bales 60 50 40 30 20 10 0 2013/14 2014/15 2015/16 2016/17 2017/18 2018/19 2019/20 2020/21 2021/22 Minimum Maximum Source: USDA, Interagency Commodity Estimates Committee. 27
Outlook for 2022/23 U.S. Cotton Area Planted acreage expected to rise. Total plantings at 12.7 M acres 13% increase. NCC survey indicated 12.0 M acres. Drought conditions could play key role in Southwest. Cotton prices began gaining ground on corn and soybeans starting in April 2021. December 22 cotton contract has been 20-30 percent above year- earlier in February. Highest since 2011. Corn and soybean prices showing recent strength with weather and geopolitical problems. 29
U.S. Cotton Planted Area: A Historical Perspective Million acres 18 1966-2021 average 15 12 9 Area in 2022 near long run average 6 3 1966 1971 1976 1981 1986 1991 1996 2001 2006 2011 2016 2021 Marketing year Source: USDA, National Agricultural Statistics Service. 30
U.S. Cotton Area, Yield, and Production Key Factor Includes Adequate Soil Moisture Southwest to account for more than 60% of planted area Unit 2021/22 2022/23 Change(%) Planted area Mil. acres 11.22 12.7 13.2 Harvested area " 9.97 10.2 2.2 Abandonment rate % 11.1 19.7 8.6 Yield/harvested acre Lbs. 849 856 0.8 Production Mil. bales 17.62 18.2 3.3 Source: USDA, Interagency Commodity Estimates Committee. 32
Larger U.S. Export Forecast: Contingent Upon U.S. weather situation; size and quality of U.S. crop Global Economic Growth; Consumer demand China consumption-production gap, crop quality, policy Brazil crop prospects in calendar 2022 33
U.S. Cotton Supply & Demand Projections: Production, Exports, and Stocks Rise Attribute Unit 2021/22 2022/23 Change (%) Beginning Stocks Area Harvested Production Imports Total Supply Exports Use Total Use Ending Stocks Stock to Use % Farm Price mil. bales mil. HA mil. bales " " " " " " % cents/lb. 3.2 4.0 17.6 0.0 20.8 14.8 2.6 17.3 3.5 20.2 90.0 3.5 4.1 18.2 0.0 21.7 15.5 2.7 18.2 3.6 19.9 80.0 11.1 2.3 3.3 0.0 4.5 5.1 3.9 4.9 2.9 -0.3 -11.1 Source: USDA, Interagency Commodity Estimates Committee. 34
Global WILDCARDS Weather what is normal? COVID-19 will consumer spending shift toward purchasing services as risk declines? Polyester, Viscose, and other MMFs Policy issues in important consuming and producing countries: Belt & Road, MSP, Withhold Release Order (WRO) by U.S. Customs & Border Protection Disruption from military conflict in Eastern Europe 35
THANK YOU! Interagency Commodity Estimates Committee (ICEC) for Cotton, USDA 36