Grains and Oilseeds Outlook 2022: Factors Affecting US Markets
The 2022 outlook for U.S. grains and oilseed markets by Michael McConnell from USDA highlights key factors impacting the sector. These include global market tightness, higher input costs, elevated crop prices, and the 2022/23 crop acreage outlook. Factors framing the forecast involve uncertainties like the global pandemic, inflation, supply chain pressures, and geopolitical conditions. The data reflects changes in corn market dynamics, with differences in area planted, yields, production, and price projections.
Download Presentation

Please find below an Image/Link to download the presentation.
The content on the website is provided AS IS for your information and personal use only. It may not be sold, licensed, or shared on other websites without obtaining consent from the author. Download presentation by click this link. If you encounter any issues during the download, it is possible that the publisher has removed the file from their server.
E N D
Presentation Transcript
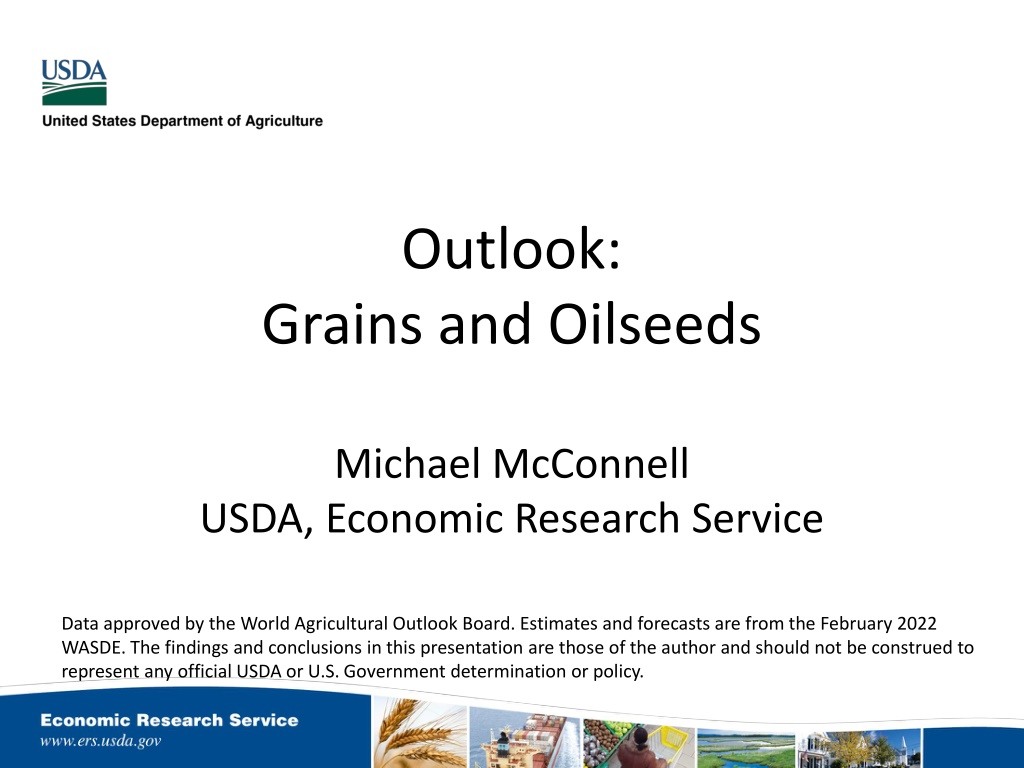
Outlook: Grains and Oilseeds Michael McConnell USDA, Economic Research Service Data approved by the World Agricultural Outlook Board. Estimates and forecasts are from the February 2022 WASDE. The findings and conclusions in this presentation are those of the author and should not be construed to represent any official USDA or U.S. Government determination or policy.
Overview Factors affecting 2022/23 outlook for U.S. grains and oilseed markets. Acreage outlook for 2022/23. Commodity balances for 2022/23. 2
Factors framing the forecast Volatility and uncertainty beyond the crop balance sheets: Global pandemic Global inflationary and supply chain pressures Geopolitical conditions across the globe Normal weather assumed for the outlook Current policy remain in place 3
Global markets tighter in recent years Global corn, wheat, and soybean markets are all several years past their recent stocks-to-use highs. Tighter markets are due to a combination of consumption growth and production disruptions. Overall, this has been supportive of global prices for grains and oilseeds. 4
Higher input costs a key factor facing U.S. producers in 2022/23 Input costs, and particularly fertilizer, have seen higher prices. Reports of availability constraints for fertilizer and other chemical inputs. Comes after prolonged period of relatively lower- cost input markets. 5
Crop prices remain at elevated levels Cash prices remain at higher levels since fall of 2020, compared with 2015 to 2019 prices. Futures markets for 2022/23 crops remain elevated. Illinois 2022 fall delivery cash prices in February (AMS): Corn: $5.33 to $5.78 Soybeans: $13.40 to $14.60 Costs of production are rising, but so have crop values. 6
Corn Market Outlook 2021/22 2022/23 Difference Area planted (mil. acres) 93.4 92.0 -1.4 Yield (bu/acre) 177.0 181.0 4.0 Million bushels Production 15,115 15,240 135 Imports 25 25 0 Exports 2,425 2,350 -75 Feed and residual 5,650 5,650 0 Food, seed, and industrial 6,760 6,840 80 Ethanol for fuel 5,325 5,400 75 Ending stocks 1,540 1,965 415 Farm average price ($/bu.) $5.45 $5.00 -$0.45 8
Sorghum Market Outlook 2021/22 2022/23 Difference Area planted (mil. acres) 7.3 6.5 -0.8 Yield (bu/acre) 69.0 69.2 0.2 Million bushels Production 448 401 -47 Imports 0 0 0 Exports 310 300 -10 Feed and residual 115 95 -30 Food, seed, and industrial 10 10 0 Ending stocks 33 29 -8 Farm average price ($/bu.) $5.45 $4.90 -$0.55 9
Wheat Market Outlook 2021/22 2022/23 Difference Area planted (mil. acres) 46.7 48.0 1.3 Winter Wheat area planted 33.6 34.3 0.7 Yield (bu/acre) 44.3 49.1 4.8 Million bushels Production 1,646 1,940 294 Imports 100 120 20 Exports 810 850 40 Feed and residual 110 100 -10 Food and seed 1,023 1,027 4 Ending stocks 648 731 83 Farm average price ($/bu.) $7.30 $6.80 -$0.50 10
Soybean Market Outlook 2021/22 2022/23 Difference Area planted (mil. acres) 87.2 88.0 0.8 Yield (bu/acre) 51.4 51.5 0.1 Million bushels Production 4,435 4,490 55 Imports 15 15 0 Exports 2,050 2,150 100 Crush 2,215 2,250 35 Seed and residual 118 124 6 Ending stocks 325 305 -20 Farm average price ($/bu.) $13.00 $12.75 -$0.25 11
Soybean Oil and Meal Market Outlook 2020/21 2021/22 2022/23 Diff. Soybean Oil Million pounds Production 25,023 26,205 26,325 120 Domestic use 23,323 25,285 26,000 715 Biofuels 8,850 11,000 12,000 1,000 Exports 1,723 1,425 1,200 -225 Average Price ($/lb) $0.569 $0.66 $0.68 $0.02 Soybean Meal Thousand short tons Production 50,565 51,909 53,050 1,141 Domestic use 37,580 37,900 38,600 700 Exports 13,768 14,400 14,800 400 Average price ($/st) $392 $410 $375 -$35 12
Concluding remarks Increase in total number of corn, soybean, and wheat acres planted in 2022. Operating margins likely tighter than 2021/22, but economic incentives are in place for additional grains and oilseeds production. Wheat: Higher production and relatively high farm prices, but increasing price competition in export and domestic feed markets. Corn: Lower prices from 2021/22 primarily due to increased global competition for exports. Soybeans: Lower South American production in 2021/22 provide an opportunity for U.S. exports in 2022/23. Domestic crush margins expected to remain strong and tilted toward the value of the oil market. 13
Like, Share, & Follow Coming Soon! Charts of Note Mobile App @USDA_ERS linkedin.com/company/USDA- Economic-Research-Service ERS.USDA.gov/subscribe ERS.USDA.gov/multimedia ERS.USDA.gov/about-ers/careers-at-ers/ 14
