Final Results of 2011 Economic Census of Cambodia Seminar

The seminar on the Final Results of the 2011 Economic Census of Cambodia was supported by the Government of Japan, Japan International Cooperation Agency (JICA), and the Government of Cambodia. It took place on 13-14 March 2012 in Phnom Penh. The seminar discussed the financial situation of establishments by industry and presented various key findings and analyses related to annual sales, distribution, and proportion of economic activities in Cambodia in 2011.

Download Presentation

Please find below an Image/Link to download the presentation.
The content on the website is provided AS IS for your information and personal use only. It may not be sold, licensed, or shared on other websites without obtaining consent from the author. Download presentation by click this link. If you encounter any issues during the download, it is possible that the publisher has removed the file from their server.
E N D
Presentation Transcript
Seminar on Final Results of 2011 Economic Census of Cambodia Supported by : Government of Japan, Japan International Cooperation Agency (JICA) and Government of Cambodia National Institute of Statistics, Ministry of Planning On 13-14 March 2012,at CJCC Phnom Penh, Cambodia 1
Financial Situation of Establishments by industry by KHIN SOVORLAK, DDG, NIS Ministry of Planning, Cambodia 2
CONTENTS 1) Annual Sales by Section of Industrial Classification and Sex of Representative - Cambodia (2011) 2) Percent Distribution of Annual Sales by Section of Industrial Classification and Sex of Representative - Cambodia (2011) 3) Annual Sales per Establishment by Section of Industrial Classification and Sex of Representative - Cambodia (2011) 4) Proportion to Average Annual Sales per Establishment by Section of Industrial Classification and Sex of Representative - Cambodia (2011) 3
CONTENTS 5) Annual Sales per Person Engaged by Section of Industrial Classification and Sex of Representative - Cambodia (2011) 6) Proportion to Average Annual Sales per Person Engaged by Section of Industrial Classification and Sex of Representative - Cambodia (2011) 4
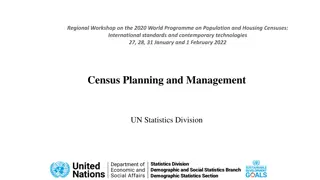
Annual Sales by Section of Industrial Classification and Sex of Representative - Cambodia (2011) Annual Sales by Section (millon USD) Both Sexes Male 57525 60000 Female B. Mining and quarrying C. Manufacturing D. Electricity, gas, steam E. Water supply; F. Construction G.Wholesale and retail H.Transportation and I. Accommodation and J. Information and K. Financial and L. Real estate activities M.Professional,scientifi N. Administrative and P. Education Q. Human health and R. Arts, entertainment S.Other service activities 50000 40000 34235 30000 20000 8615 8000 7522 10000 1077 953 563 24 26 179285492219332 76 72 0 B C D E F G H I J K L M N P Q R S
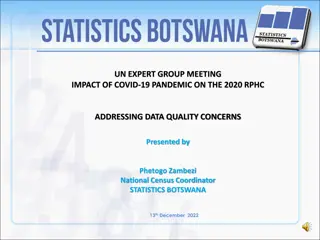
Percent Distribution of Annual Sales by Section of Industrial Classification and Sex of Representative - Cambodia (2011) Percent Distribution of Annual Sales by Section Both Sexes 50.0 Male B. Mining and quarrying C. Manufacturing D. Electricity, gas, steam E. Water supply; F. Construction G.Wholesale and retail H.Transportation and I. Accommodation and J. Information and K. Financial and L. Real estate activities M.Professional,scientifiN. Administrative and P. Education Q. Human health and R. Arts, entertainment S.Other service activities 45.0 Female 37.8 40.0 35.0 30.0 27.3 25.0 20.0 15.0 10.0 10.0 7.2 4.2 4.1 2.5 5.0 0.51.2 0.92.1 0.3 0.0 0.0 0.1 0.2 0.4 0.1 0.2 0.0 0.0 0.0 0.0 0.0 0.0 0.1 0.1 0.3 0.0 0.0 0.1 0.0 0.1 0.0 0.0 8 B C D E F G H I J K L M N P Q R S
Annual Sales per Establishment by Section of Industrial Classification and Sex of Representative - Cambodia (2011) Annual Sales per Establishment by Section Both Sexes 30000000 Male Female B. Mining and quarrying C. Manufacturing D. Electricity, gas, steam E. Water supply; F. Construction G.Wholesale and retail H.Transportation and I. Accommodation and J. Information and K. Financial and L. Real estate activities M.Professional,scientifiN. Administrative and P. Education Q. Human health and R. Arts, entertainment S.Other service activities 25000000 20000000 15000000 10000000 5000000 10 0 B C D E F G H I J K L M N P Q R S
Proportion to Average Annual Sales per Establishment by Section of Industrial Classification and Sex of Representative - Cambodia (2011) Proportion to Average Annual Sales per Establishment 120.0 B. Mining and quarrying C. Manufacturing D. Electricity, gas, steam E. Water supply; F. Construction G.Wholesale and retail H.Transportation and I. Accommodation and J. Information and K. Financial and L. Real estate activities M.Professional,scientifiN. Administrative and P. Education Q. Human health and R. Arts, entertainment S.Other service activities Both Sexes 107.1 Male 100.0 Female 79.0 80.0 60.0 40.0 20.0 8.8 6.6 4.8 3.2 2.6 2.2 2.1 2.1 1.8 1.8 1.7 1.2 1.0 0.8 0.7 0.6 0.5 0.5 0.5 0.4 0.4 0.3 0.2 0.2 0.1 0.1 0.1 0.1 0.1 0.1 0.0 0.0 0.0 12 B C D E F G H I J K L M N P Q R S
Annual Sales per Person Engaged by Section of Industrial Classification and Sex of Representative - Cambodia (2011) Both Sexes Annual Sales per Person engaged(USD) Male 2500000 Female B. Mining and quarrying C. Manufacturing D. Electricity, gas, steam E. Water supply; F. Construction G.Wholesale and retail H.Transportation and I. Accommodation and J. Information and K. Financial and L. Real estate activities M.Professional,scientifiN. Administrative and P. Education Q. Human health and R. Arts, entertainment S.Other service activities 2000000 1500000 1000000 500000 14 0 B C D E F G H I J K L M N P Q R S
Proportion to Average Annual Sales per Person Engaged by Section of Industrial Classification and Sex of Representative - Cambodia (2011) Proportion to Average Annual Sales Both Sexes 35.0 Male 31.0 Female 30.0 28.4 B. Mining and quarrying C. Manufacturing D. Electricity, gas, steam E. Water supply; F. Construction G.Wholesale and retail H.Transportation and I. Accommodation and J. Information and K. Financial and L. Real estate activities M.Professional,scientifiN. Administrative and P. Education Q. Human health and R. Arts, entertainment S.Other service activities 25.0 20.0 15.0 10.0 5.0 3.8 2.4 1.7 1.6 1.5 1.1 1.1 0.9 0.8 0.7 0.5 0.5 0.5 0.5 0.4 0.3 0.3 0.2 0.2 0.2 0.2 0.2 0.1 0.1 0.1 0.1 0.1 0.1 0.1 0.1 0.0 0.0 0.0 16 B C D E F G H I J K L M N P Q R S
Business Condition in Cambodia Annual Sales is Annual Expenses is Profit & loss USD 120 billions USD 101 billions USD 19 billions Profit & loss in Cambodia billions 140 120 16% 100 Annual Sales 80 Annual Expenses Annual Expenses Profit & loss 60 120 84% 101 Profit & loss 40 20 19 0 Annual Sales Annual Expenses Profit & loss 29
Conclusion To enhance domestic production and break away from this high- cost economy is an important issues in future for the further socio-economic development of Cambodia. (Refer to table 21-1, 24-1 and 27-1.) Future investment Legal Next election 30
Q & A 32


![Explore the Exciting World of Live Music Through [Insert Town/City] Census!](/thumb/148894/explore-the-exciting-world-of-live-music-through-insert-town-city-census.jpg)