Annual Energy Outlook 2023
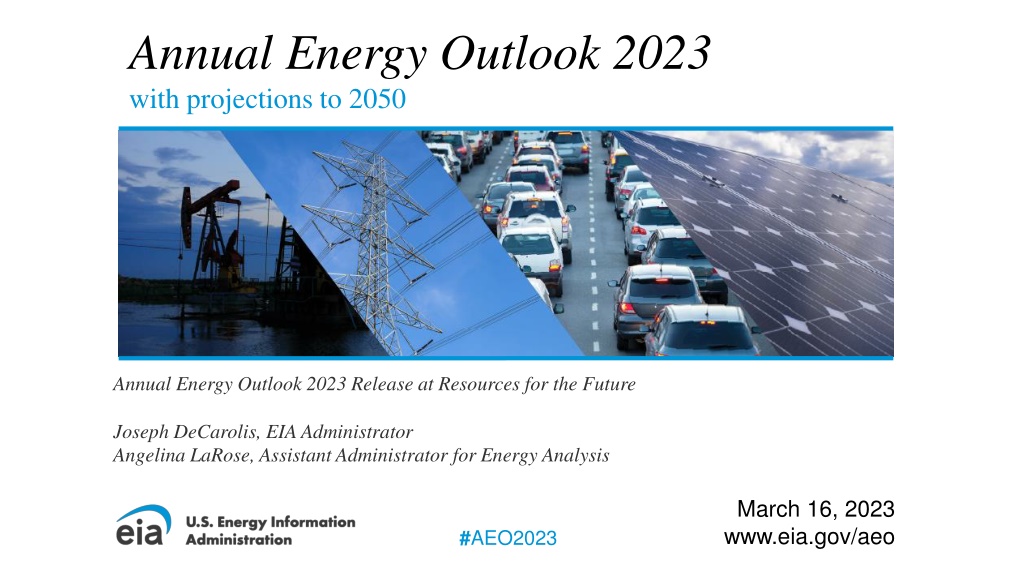
The U.S. Energy Information Administration (EIA) releases the Annual Energy Outlook 2023 with projections to 2050, exploring long-term energy trends in the United States. The report includes different cases with varying assumptions, such as economic growth, oil prices, and zero-carbon technology costs. It also highlights the Inflation Reduction Act and its implications on energy systems. However, certain IRA provisions were not included in the outlook due to modeling challenges and alignment issues.

Download Presentation

Please find below an Image/Link to download the presentation.
The content on the website is provided AS IS for your information and personal use only. It may not be sold, licensed, or shared on other websites without obtaining consent from the author. Download presentation by click this link. If you encounter any issues during the download, it is possible that the publisher has removed the file from their server.
E N D
Presentation Transcript
Annual Energy Outlook 2023 with projections to 2050 Annual Energy Outlook 2023 Release at Resources for the Future Joseph DeCarolis, EIA Administrator Angelina LaRose, Assistant Administrator for Energy Analysis March 16, 2023 www.eia.gov/aeo #AEO2023
What does EIA do? The U.S. Energy Information Administration (EIA) is the statistical and analytical agency within the U.S. Department of Energy. EIA is the nation's premier source of energy information. By law, our data, analyses, and forecasts are independent of approval by any other officer or employee of the U.S. government. Our Annual Energy Outlook 2023 explores long-term energy trends in the United States. AEO2023 Release, RFF March 16, 2023 2
Whats new in the 2023 Annual Energy Outlook? A focus on the narrative Technical notes Emphasis on the range of results New combination cases AEO2023 Release, RFF March 16, 2023 3
The AEO2023 includes cases that vary technical and economic assumptions, including combination cases that extend the bounds of uncertainty All cases reflect current laws and regulations as of November 2022, including the Inflation Reduction Act. Reference 1.9% annual GDP growth; Brent = $101 per barrel (b) in 2050 Economic Growth Low: 1.4% annual GDP growth High: 2.3% Oil Price Low: Brent = $51/b in 2050 High: Brent = $190/b in 2050 Oil and Gas Supply Low: 50% lower oil and gas resource recovery and 50% higher drilling costs relative to the Reference case High: 50% higher oil and gas resource recovery and 50% lower drilling costs relative to the Reference case Zero-Carbon Technology Cost (electric power sector) Low: About 40% reduction in cost by 2050 High: No reduction in costs Combination Combinations of Economic Growth and Zero-Carbon Technology Cost cases AEO2023 Release, RFF March 16, 2023 4
AEO2023 Issues in Focus: Inflation Reduction Act Inflation Reduction Act Issues in Focus released today No IRA case High Uptake case Low Uptake case Detailed IRA assumptions available on the AEO website AEO2023 Release, RFF March 16, 2023 5
IRA-related caveats to keep in mind The IRA contains a complex package of incentives, many of which are challenging to model. We do not explicitly include certain IRA provisions in AEO2023 for three general reasons: Guidance is not yet available on how a provision will be enacted or how agencies will implement it. Provisions requiring significant model modifications that were not possible to implement this year. Provisions that do not align with our analytic resolution, for example energy communities. As a result, all energy system impacts of the IRA are not represented in AEO2023. We have documented our modeling assumptions related to all IRA provisions, which are available with today s AEO2023 release. We will refine our estimates over time as IRA implementation details become available and we update our modeling capability. AEO2023 Release, RFF March 16, 2023 6
AEO2023 Highlights Energy-related CO2 emissions fall across all AEO2023 cases because of increased electrification, higher equipment efficiencies, and more zero-carbon electricity generation. Renewable generating capacity grows in all regions of the United States in all AEO2023 cases, supported by growth in installed battery capacity. Technological advancements and electrification drive projected decreases in demand- side energy intensity. The United States remains a net exporter of petroleum products and of natural gas through 2050 in all AEO2023 cases. AEO2023 Release, RFF March 16, 2023 7
AEO2023 Highlights Energy-related CO2 emissions fall across all AEO2023 cases because of increased electrification, higher equipment efficiencies, and more zero-carbon electricity generation. Renewable generating capacity grows in all regions of the United States in all AEO2023 cases, supported by growth in installed battery capacity. Technological advancements and electrification drive projected decreases in demand- side energy intensity. The United States remains a net exporter of petroleum products and of natural gas through 2050 in all AEO2023 cases. AEO2023 Release, RFF March 16, 2023 8
By 2030, energy-related CO2emissions fall 25% to 38% below 2005 levels Total energy-related carbon dioxide emissions million metric tons 2022 history projections percentage relative to 2005 7,000 6,000 100% High Economic Growth-High ZTC No IRA Reference Low Economic Growth-Low ZTC 5,000 80% 4,000 60% 3,000 40% 2,000 20% 1,000 0 0% 2000 2005 2010 2015 2020 2025 2030 2035 2040 2045 2050 Data source: U.S. Energy Information Administration, Annual Energy Outlook 2023 (AEO2023) Note: Shaded regions represent maximum and minimum values for each projection year across the AEO2023 Reference case and side cases. ZTC=Zero-Carbon Technology Cost; IRA=Inflation Reduction Act. AEO2023 Release, RFF March 16, 2023 9
In the No IRA and Low Uptake cases, U.S. CO2emissions fall 26% and 27%, respectively, by 2030 from 2005. The Reference and High Uptake cases go further and reach reductions of about 33% and 34%, respectively. Energy-related CO2 emissions billion metric tons all sectors electricity sector 2022 2022 3.0 7.5 history projections history projections 6.0 No IRA 2.0 4.5 Low Uptake 3.0 High Uptake 1.0 1.5 Reference 0.0 0.0 2005 2020 2035 2050 2005 2020 2035 2050 Data source: U.S. Energy Information Administration, Annual Energy Outlook 2023 (AEO2023) Note: Charts include CO2 emissions from fossil fuel and industrial feedstock uses. This scope excludes industrial process emissions, agriculture, waste, land use, and other greenhouse gases such as methane and hydrofluorocarbons. Industrial emissions include combined-heat-and-power plants that have a non-regulatory status and small on-site generating systems. AEO2023 Release, RFF March 16, 2023 10
AEO2023 Highlights Energy-related CO2 emissions fall across all AEO2023 cases because of increased electrification, higher equipment efficiencies, and more zero-carbon electricity generation. Renewable generating capacity grows in all regions of the United States in all AEO2023 cases, supported by growth in installed battery capacity. Technological advancements and electrification drive projected decreases in demand- side energy intensity. The United States remains a net exporter of petroleum products and of natural gas through 2050 in all AEO2023 cases. AEO2023 Release, RFF March 16, 2023 11
Total installed generating capacity more than doubles across most scenarios Total installed capacity in all sectors, 2022 (history) and 2050 gigawatts 2022 Reference stand-alone storage solar wind oil and natural gas nuclear other coal Low Oil and Gas Supply High Oil and Gas Supply Low ZTC High ZTC Low Economic Growth High Economic Growth Low Oil Price High Oil Price High Economic Growth-High ZTC High Economic Growth-Low ZTC Low Economic Growth-High ZTC Low Economic Growth-Low ZTC 0 500 1,000 1,500 2,000 2,500 3,000 3,500 Data source: U.S. Energy Information Administration, Annual Energy Outlook 2023 (AEO2023) Note: ZTC=Zero-Carbon Technology Cost; other=geothermal, biomass, municipal waste, fuel cells, hydroelectric, pumped hydro storage 12 AEO2023 Release, RFF March 16, 2023
Power demand is increasingly met by renewables U.S. electricity generation by select technologies for all cases billion kilowatthours solar2022 natural gas wind2022 2022 3,000 3,000 3,000 history projections Ref 2,000 2,000 2,000 Ref Ref 1,000 1,000 1,000 0 0 0 2010 2020 2030 2040 2050 2010 2020 2030 2040 2050 nuclear 2022 2010 2020 2030 2040 2050 coal 2022 3,000 3,000 2,000 2,000 1,000 1,000 Ref Ref 0 0 2010 2020 2030 2040 2050 2010 2020 2030 2040 2050 Data source: U.S. Energy Information Administration, Annual Energy Outlook 2023 (AEO2023) Note: Shaded regions represent maximum and minimum values for each projection year across the AEO2023 Reference case and side cases. Ref=Reference case AEO2023 Release, RFF March 16, 2023 13
Solar and wind generate a majority of U.S. electricity by 2050 in the Reference and High Uptake cases U.S. net electricity generation by fuel billion kilowatthours No IRA 2022 history projections High Uptake Reference Low Uptake 2022 2022 2022 6,000 history projections 6,000 6,000 history projections history projections 6,000 5,000 5,000 5,000 5,000 solar* wind natural gas coal nuclear other** 4,000 4,000 4,000 4,000 3,000 3,000 3,000 3,000 2,000 2,000 2,000 2,000 1,000 1,000 1,000 1,000 0 0 0 0 2005 2020 2035 2050 2005 2020 2035 2050 2005 2020 2035 2050 2005 2020 2035 2050 Data source: U.S. Energy Information Administration, Annual Energy Outlook 2023 (AEO2023) Note: IRA=Inflation Reduction Act *Includes utility-scale and end-use photovoltaic generation and excludes off-grid photovoltaics. **Includes petroleum, conventional hydroelectric power, geothermal, wood and other biomass, pumped storage, non-biogenic municipal waste in the electric power sector, refinery gas, still gas, batteries, chemicals, hydrogen, pitch, purchased steam, sulfur, and miscellaneous technologies. AEO2023 Release, RFF March 16, 2023 14
More intermittent renewables lead to more curtailment and usage of battery storage Hourly U.S. electricity generation and load by fuel for selected cases and representative years billion kilowatthours Low Zero-Carbon Technology Cost case, 2050 Low Oil and Gas Supply case, 2050 Reference case, 2050 Reference case, 2022 400 load, excluding storage curtailment stand-alone storage pumped storage hybrid solar PV stand-alone solar PV wind hydroelectric natural gas combined-cycle natural gas and oil peakers nuclear coal 300 200 100 0 -100 1 12 241 12 24 hour of the day 1 12 24 1 12 24 Data source: U.S. Energy Information Administration, Annual Energy Outlook 2023 (AEO2023) Note: Negative generation represents charging of energy storage technologies such as pumped hydro and battery storage. Hourly dispatch estimates are illustrative and are developed to determine curtailment and storage operations; final dispatch estimates are developed separately and may differ from total utilization as this figure shows. Standalone solar photovoltaic (PV) includes both utility-scale and end-use PV electricity generation. AEO2023 Release, RFF March 16, 2023 15
AEO2023 Highlights Energy-related CO2 emissions fall across all AEO2023 cases because of increased electrification, higher equipment efficiencies, and more zero-carbon electricity generation. Renewable generating capacity grows in all regions of the United States in all AEO2023 cases, supported by growth in installed battery capacity. Technological advancements and electrification drive projected decreases in demand- side energy intensity. The United States remains a net exporter of petroleum products and of natural gas through 2050 in all AEO2023 cases. AEO2023 Release, RFF March 16, 2023 16
U.S. energy consumption increases to 2050, and electricity plays an increasingly larger role Total energy consumption by end-use sector quadrillion British thermal units 2022 50 history projections 45 40 industrial 35 30 transportation 25 residential commercial 20 15 10 5 0 2000 Data source: U.S. Energy Information Administration, Annual Energy Outlook 2023 (AEO2023) Note: Total consumption in end-use sectors includes purchased electricity and electricity-related losses. Each line represents AEO2023 Reference case projections. Shaded regions represent maximum and minimum values for each projection year across the AEO2023 Reference case and side cases. 2005 2010 2015 2020 2025 2030 2035 2040 2045 2050 AEO2023 Release, RFF March 16, 2023 17
Average energy intensity declines through 2050 across all cases Residential delivered energy intensity million British thermal units per household 2022 Commercial delivered energy intensity thousand British thermal units per square foot 2022 110 110 history projections history projections 100 100 90 90 High Oil and Gas Supply Reference Low Oil and Gas Supply 80 80 Low Economic Growth-Low ZTC Reference Low Oil and Gas Supply 70 70 2020 Data source: U.S. Energy Information Administration, Annual Energy Outlook 2023 (AEO2023) Note: Shaded regions represent maximum and minimum values for each projection year across the AEO2023 Reference case and side cases. ZTC=Zero-Carbon Technology Cost 2030 2040 2050 2015 2025 2035 2045 AEO2023 Release, RFF March 16, 2023 18
Light-duty vehicle fuel economy and electric vehicle market share increase through 2050 due to rising CAFE Standards and other incentives Light-duty vehicle average fuel economy miles per gallon 2022 history projections Market share of electric light-duty vehicles* percentage of sales 2022 history projections 45 40% High Oil Price 40 30% High Oil Price Reference 35 Reference Low Oil Price 20% 30 Low Oil Price 10% 25 20 0% 2010 Data source: U.S. Energy Information Administration, Annual Energy Outlook 2023 (AEO2023) Note: *Includes battery electric and plug-in hybrid electric vehicles. Shaded regions represent maximum and minimum values for each projection year across the AEO2023 Reference case and side cases. 2020 2030 2040 2050 2010 2020 2030 2040 2050 AEO2023 Release, RFF March 16, 2023 19
IRA incentives speed growth in sales of electric vehicles Market share of electric light-duty vehicles* percentage 2022 20% history projections 15% No IRA Low Uptake High Uptake 10% Reference 5% 0% 2010 2020 2030 2040 2050 Data source: U.S. Energy Information Administration, Annual Energy Outlook 2023 (AEO2023) Note: *Includes battery electric and plug-in hybrid electric vehicles. IRA=Inflation Reduction Act AEO2023 Release, RFF March 16, 2023 20
AEO2023 Highlights Energy-related CO2 emissions fall across all AEO2023 cases because of increased electrification, higher equipment efficiencies, and more zero-carbon electricity generation. Renewable generating capacity grows in all regions of the United States in all AEO2023 cases, supported by growth in installed battery capacity. Technological advancements and electrification drive projected decreases in demand- side energy intensity. The United States remains a net exporter of petroleum products and of natural gas through 2050 in all AEO2023 cases. AEO2023 Release, RFF March 16, 2023 21
In all cases, we project that the United States will remain a net exporter of petroleum products through 2050 Petroleum and other liquids consumption million barrels per day Petroleum and other liquids production million barrels per day Petroleum products net exports million barrels per day 2022 2022 2022 35 35 35 High Oil and Gas Supply history projections history projections history projections 30 30 30 High Oil and Gas Supply Reference Low Growth- Low ZTC 25 25 25 Reference 20 20 20 15 15 15 Low Oil and Gas Supply High Oil Price Reference Low Oil Price 10 10 10 5 5 5 0 0 0 2010 2020 2030 2040 2050 2010 2020 2030 2040 2050 2010 2020 2030 2040 2050 Data source: U.S. Energy Information Administration, Annual Energy Outlook 2023 (AEO2023) Note: Biofuels are not included in petroleum and other liquids production or consumption. Shaded regions represent maximum and minimum values for each projection year across the AEO2023 Reference case and side cases. ZTC=Zero-Carbon Technology Cost AEO2023 Release, RFF March 16, 2023 22
Liquefied natural gas exports drive production; domestic consumption remains stable Liquefied natural gas exports trillion cubic feet Natural gas consumption trillion cubic feet 2022 history projections Dry natural gas production trillion cubic feet 2022 history projections 2022 60 60 60 High Oil and Gas Supply history projections 50 50 High Economic Growth- High ZTC 50 Reference 40 40 40 Low Oil and Gas Supply 30 30 Reference 30 Low Oil and Gas Supply 20 20 20 High Oil Price Reference Low Oil Price 10 10 10 0 0 0 2010 2020 2030 2040 2050 2010 2020 2030 2040 2050 2010 2020 2030 2040 2050 Data source: U.S. Energy Information Administration, Annual Energy Outlook 2023 (AEO2023) Note: Shaded regions represent maximum and minimum values for each projection year across the AEO2023 Reference case and side cases. ZTC=Zero-Carbon Technology Cost AEO2023 Release, RFF March 16, 2023 23
Upcoming AEO2023 Issues in Focus Liquefied Natural Gas (LNG) Issues in Focus coming next month High LNG Price case Low LNG Price case Fast Builds + High LNG Price case AEO2023 Release, RFF March 16, 2023 24
View the full report at eia.gov/aeo Contact us at AnnualEnergyOutlook@eia.gov AEO2023 Release, RFF March 16, 2023 25