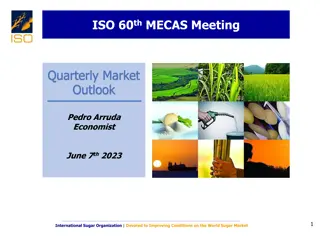
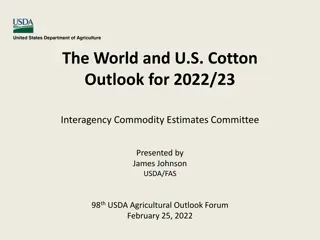
Impact of COVID-19 on Commodity Markets: Developments, Outlook, and Risks
The COVID-19 pandemic has caused significant disruptions in global commodity markets, leading to forecasts of decreased global growth, oil price reductions, and shifts in metal and gold prices. The challenging economic outlook includes projections of a 5.2% contraction in global GDP in 2020, with risks of deeper recession and increased poverty levels. Commodity prices were stable until the onset of the pandemic, affecting agriculture, metals, and energy sectors. The collapse in oil and transport demand has been particularly pronounced.

Download Presentation

Please find below an Image/Link to download the presentation.
The content on the website is provided AS IS for your information and personal use only. It may not be sold, licensed, or shared on other websites without obtaining consent from the author. Download presentation by click this link. If you encounter any issues during the download, it is possible that the publisher has removed the file from their server.
E N D
Presentation Transcript
Commodity Markets in the context of COVID-19: Developments, Outlook, and Risks 1
Commodities before and after COVID-19 Before After Change Global growth for 2020 (percent, year-on-year) 2.5 -5.2 -7.7 pp Oil price forecast for 2020 (US $/bbl) 58 35 -39.7 % Global oil demand growth forecast for 2020 (mb/d) 101.5 91.7 -9.7 % Metal price forecast for 2020 (index, 2010 = 100) 78 68 -12.8 % Gold price forecast for 2020 (US $/toz) 1,470 1,600 +8.8 % US dollar, actual (index, Jan and May 2020 averages) 115 123 +6.6 % 10-year U.S. Treasury, actual (percent, Jan and May 2020 averages) 1.76 0.67 -108 bps Source: Federal Reserve Bank of St. Louis, International Energy Agency, and World Bank. Notes: Global growth forecasts are from the Global Economic Prospects (June 2020). Commodity price forecasts for oil, metals, and gold are from the Commodity Markets Outlook (October 2019 and April 2020 editions). Oil demand forecast comes from IEA Oil Market Report (January and June 2020). US dollar represents the broad trade-weighted index for goods and services (DTWEXBGS) and 10-year Treasury represents the constant maturity rate (DGS10), both January and May 2020 averages. pp and bps denote percentage points and basis points, respectively. 2
Challenging global economic outlook Percent 6 Recent developments The COVID-19 pandemic has delivered an enormous economic shock to the global economy, pushing many countries into steep recession. The baseline forecast envisions a 5.2 percent contraction in global GDP in 2020 the deepest global recession in eight decades. Per capita incomes in most EMDEs are expected to shrink this year, tipping many millions into poverty. The global recession would be deeper if bringing the pandemic under control took longer than expected, or if financial stress triggered cascading defaults. Advanced Economies EMDEs World 5.0 4.6 4 4.5 4.5 4.3 4.1 3.9 3.8 3.5 2 2.3 2.3 2.1 2.0 1.7 1.6 1.3 0 -2 -2.5 -4 -6 -7.0 -8 2013 2014 2015 2016 2017 2018 2019E 2020F 2021F Source: World Bank, Global Economic Prospects (June 2020 edition). Note: EMDE stands for Emerging Markets and Developing Economies. 3
Commodity prices were fairly stable ... until COVID-19 US$ index, nominal terms, 2010 = 100 100 COVID-19 Agriculture 80 Metals 60 40 Energy 20 Jan-15 Jul-15 Jan-16 Jul-16 Jan-17 Jul-17 Jan-18 Jul-18 Jan-19 Jul-19 Jan-20 Source: World Bank Note: Last observation is May 2020. The shaded area ( COVID-19 ) reports February 2020 onwards. 4
Oil and transport demand collapsed following the outbreak Declines in global oil demand Traveler journeys in the U.S. Million 1993 -0.2 3.0 2019 2020 1983 -0.2 2.5 2008 -0.7 1975 -0.8 2.0 2009 -1.0 1974 -1.4 1.5 1982 -2.7 1.0 1981 -3.1 1980 -4.1 0.5 2020F -8.1 0.0 -9.0 -7.0 -5.0 -3.0 -1.0 Mar-01 Mar-16 Mar-31 Apr-15 Apr-30 May-15 May-30 Jun-14 Percent Source: BP Statistical Review, International Energy Agency (June 2020 monthly report), U.S. Transportation Administration, World Bank. Notes: Right figure shows checkpoint travel numbers reported by the U.S. Transport Security Administration. Last observation is 06/21/2020. 6
Brent and WTI prices during COVID-19 Brent WTI US$/bbl US$/bbl 60 70 January 20 COVID-19 human- to human transmission confirmed April 13 OPEC+ agree to new cuts March 6 OPEC+ fail to agree on cuts May 2020 futures contract June 2020 futures contract 60 40 50 20 40 0 30 -20 20 -40 10 2-Mar 10-Mar 18-Mar 26-Mar 3-Apr 11-Apr 19-Apr 1-Jan 31-Jan 1-Mar 31-Mar 30-Apr 30-May Source: Bloomberg and World Bank Note: Last observation is June 16 (Brent) and April 21 (WTI). 7
Market and policy responses to the oil price collapse Rig count in the U.S. Reaction by OPEC+, G20, and others Oct 10, 2014: 1,609 Jan-Mar 2020: 675 June 19, 2020: 189 OPEC+ agreedin April to cut 9.7 mb/d in May and June 2020 (recently extended to July), reducing to 7.7mb/d from July 2020 to December 2020, and 5.8 mb/d from January 2021 to April 2022. At a G20 meeting, other countries, including the United States and Canada, pledged to support the oil market through market-driven cuts. Several governments announced oil purchases to fill their strategic reserves. Norway announced a reduction of 0.25 mb/d in June and 0.13 mb/d for the second half of 2020. Count 700 600 500 400 300 200 100 0 3-Jan 7-Feb 13-Mar 9-Apr 15-May 19-Jun Source: Baker Hughes Note: First and last observations are January 3 and June 19, 2020. 8
Oil prices since 2011: The tail of two averages US$/bbl, nominal 120 $104/bbl 100 80 60 $54/bbl 40 20 Jan-11 Jan-12 Jan-13 Jan-14 Jan-15 Jan-16 Jan-17 Jan-18 Jan-19 Jan-20 Source: World Bank Note: The dotted lines represent averages for January 2011 to August 2014 and January 2015 to May 2020. Last observation is May 2020. 9
Base metals prices are tumbling as well US$ index, 2010=100 $/mt 100 130 110 90 Base metals index [left] 90 80 70 Iron ore [right] 70 50 60 30 Jan-15 Jul-15 Jan-16 Jul-16 Jan-17 Jul-17 Jan-18 Jul-18 Jan-19 Jul-19 Jan-20 Source: World Bank Note: Last observation is May 2020. The base metals price index include aluminum, copper, lead, nickel, tin, and zinc. 10
China dominates metal consumption Million metric tons 18 15 Rest of the world 12 9 China 6 3 0 1995 1997 1999 2001 2003 2005 2007 2009 2011 2013 2015 2017 2019 Source: World Bank and World Bureau of Metal Statistics Notes: Last observation is 2019Q2. 11
Precious metals prices: Diverging trends US$/toz US$/toz 1,300 1,800 Platinum [left] Gold [right] 1,200 1,600 1,100 1,000 1,400 900 1,200 800 700 1,000 Jan-15 Jul-15 Jan-16 Jul-16 Jan-17 Jul-17 Jan-18 Jul-18 Jan-19 Jul-19 Jan-20 Source: World Bank Note: Last observation is May 2020. 12
Agricultural prices have been remarkably stable US$ index, nominal, 2010 = 100 140 Food 120 Raw materials 100 80 Beverages 60 Jan-11 Jan-12 Jan-13 Jan-14 Jan-15 Jan-16 Jan-17 Jan-18 Jan-19 Jan-20 Source: World Bank. Note: Last observation is May 2020. The shaded area highlights the relative stability of most agricultural price during the past 6 years. 13
Stock-to-use ratios point to plentiful supplies Main grains Aggregate for 12 commodities Ratio Ratio 0.45 0.40 Maize Rice Wheat 0.40 0.35 0.35 0.30 0.30 0.25 0.25 0.20 0.20 0.15 0.15 0.10 0.10 2000 2003 2006 2009 2012 2015 2018 2000 2003 2006 2009 2012 2015 2018 Source: U.S. Department of Agriculture (June 2020 update). Notes: The aggregate stocks-to-use ratio (right panel) comprises of 12 grains and edible oils and has been aggregated according to calorific content. Years denote crop seasons (i.e. 2019 refers to the 2019-20 crop season). 14
Where are commodity prices heading in the long term? Index, constant (2010 = 100) 160 Forecasts as of April 23, 2020 Agriculture 120 80 Metals 40 Energy 0 1960 1965 1970 1975 1980 1985 1990 1995 2000 2005 2010 2015 2020 2025 2030 Source: World Bank, Commodity Markets Outlook, April 2020 edition. Note: The period 2020-30 refers to forecasts. 15
Paths/risks to recovery and long term implications Paths/risks to recovery V-shaped: Base-case scenario U-shaped: Delayed removal of restrictive measures W-shaped: Second COVID wave L-shaped: Long delays to effective treatment or vaccine Long-term implications Increasing transport costs due to additional checks Permanent unwinding of supply chains Increasing substitution among commodities Changing consumer behavior Restrictive policy responses 16