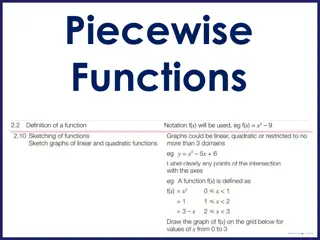
Understanding Quadratic Functions: Graphing and Characteristics
This lesson focuses on graphing quadratic functions of the form f(x) = ax^2, where students will learn to identify key characteristics such as the vertex, axis of symmetry, and behavior of the graph. By analyzing graphs, they can determine domain, range, and whether the function is increasing or decreasing. The content provides insights into the parent quadratic function, transformations, and properties of quadratic graphs to help students grasp the concepts effectively.

Download Presentation

Please find below an Image/Link to download the presentation.
The content on the website is provided AS IS for your information and personal use only. It may not be sold, licensed, or shared on other websites without obtaining consent from the author. Download presentation by click this link. If you encounter any issues during the download, it is possible that the publisher has removed the file from their server.
E N D
Presentation Transcript
8.1 Graphing f(x)=ax2 1. Students will be able to identify characteristics of quadratic functions. 2. Students will be able to graph quadratic functions of the form f(x)=ax2. We will now be graphing quadratics, starting with the easy form and adding complexity. Therefore, it is important to make sure you get each section as we move forward
1. Students will be able to identify characteristics of quadratic functions. A quadratic function is a nonlinear function that can be written in the standard form y=ax2+bx+c, where a 0. The U-shaped graph of a quadratic function is called a parabola. In this lesson we will graph quadratic functions, where b and c equal 0.
1. Students will be able to identify characteristics of quadratic functions. Characteristics of Quadratic Functions The parent quadratic function (mother function) is f(x)=ax2 The graphs of all other quadratic functions are transformations of the graph of the mother function. So we say Shift happens to mother functions The vertical line that divides the parabola into two symmetric parts is the axis of symmetry. The axis of symmetry passes through the vertex. axis of symmetry AoS The lowest point on a parabola that opens up or the highest point on a parabola that opens down is the vertex. vertex
Consider the graph of the quadratic function. Using the graph, you can identify characteristics such as the vertex, axis of symmetry (AoS), and the behavior of the graph. You can also determine the following: The domain is all real numbers The range is all real numbers greater than or equal to -2. When x < -1, y decreases. When x > -1, y increases. Function is decreasing Function is increasing AoS x=-1 vertex (-1,-2)
Using the graph, you can identify characteristics such as the vertex, axis of symmetry (AoS), and the behavior of the graph. You can also determine the following: The domain is all real numbers The range is all real numbers greater than or equal to -3. When x < 2, y decreases. When x > 2, y increases. Function is decreasing Function is increasing AoS x=2 vertex (2,-3)
Using the graph, you can identify characteristics such as the vertex, axis of symmetry (AoS), and the behavior of the graph. vertex (-3,4) AoS x=-3 You can also determine the following: The domain is all real numbers The range is all real numbers less than or equal to 4. When x < -3, y increases. When x > -3, y decreases. Function is increasing Function is decreasing
2. Students will be able to graph quadratic functions of the form f(x)=ax2. Using DESMOS we will graph f(x)=ax2 In the equation area type y=ax2 Click the add slider for a Change the slider bounders to -3 to 3 with a step of 0.1 Now move the slider to see what happens to the graph
2. Students will be able to graph quadratic functions of the form f(x)=ax2. Questions to answer. 1. What does the a do? changes the direction of the parabola and its width. 2. What values of a makes the graph open up? Open down? when a is positive (a > 0) opens up when a is negative (a < 0) opens down 3. What values of a makes the graph wider? Narrower? when 0 < a < 1 or -1 < a < 0 graph is wider (when a is between 0 and 1) when a > 1 or a < -1 graph is narrower (when a is greater then 1) Can you make the graph shift up or down? How? Now you are shifting a mother functions