Understanding Quadratic Functions: Graphing and Analysis
This content covers graphing quadratic functions in the form f(x)=ax^2+bx+c, focusing on finding maximum and minimum values, domain, and range. Key concepts include determining the direction of the parabola, identifying the y-intercept and axis of symmetry, finding the vertex, and plotting points to graph the function effectively.
Download Presentation

Please find below an Image/Link to download the presentation.
The content on the website is provided AS IS for your information and personal use only. It may not be sold, licensed, or shared on other websites without obtaining consent from the author. Download presentation by click this link. If you encounter any issues during the download, it is possible that the publisher has removed the file from their server.
E N D
Presentation Transcript
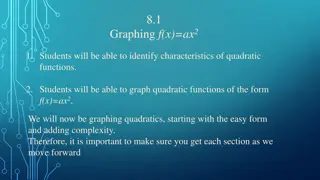
8.3 Graphing f(x)=ax2 + bx + c 1. Students will be able to graph quadratic functions of the form f(x)=ax2 + bx + c. 2. Students will be able to find the maximum and minimum values of quadratic functions and describe the domain and range. So we are looking now at the general/standard form of parabolas. Remembering everything about parabolas up to this point will make this section a lot easier.
1. Students will be able to graph quadratic functions of the form f(x)=ax2 +bx +c. Remember what does a do to the parabola? If a > 0 (positive), the parabola opens upward. If a < 0 (negative), the parabola opens downward. If a > 1 or a < -1, the parabola is narrower than y=x2. If 0 < a < 1 or -1 < a < 0, the parabola is wider than y=x2. The y intercept will always be c in this form. Now we need to find the AoS ? = ? 2? This is a small new equation you need to learn. In chapter 9 you will learn where this comes from.
1. Students will be able to graph quadratic functions of the form f(x)=ax2 +bx +c. ? Since the AoS is ? = Vertex. 2?, then we know the x coordinate of the Because the AoS goes through the Vertex and the AoS is x equals, thus the AoS equals the x coordinate of the Vertex. Since we have the x coordinate of the vertex, now we need to find the y coordinate of the vertex. To find the y coordinate, we plug in the x coordinate into the function.
1. Students will be able to graph quadratic functions of the form f(x)=ax2 +bx +c. Steps to graphing f(x)=ax2 +bx +c. 1. Determine direction of parabola by looking at a. 2. Determine the y intercept = c. Plot on graph. 3. Determine the AoS, ? = ? 2?. Put on graph ? 4. Find the Vertex by plugging in the AoS to the function ? Plot on graph 5. Plug in another point into the function close to the AoS. And plot. 2?.
1. Students will be able to graph quadratic functions of the form f(x)=ax2 +bx +c. Steps to graphing f(x)=ax2 +bx +c. 1. Determine direction of parabola by looking at a. 2. Determine the y intercept = c. Plot on graph. 3. Determine the AoS, ? = on graph 4. Find the Vertex by plugging in the AoS to the function ? on graph 5. Plug in another point into the function close to the AoS. And plot. Graph ?(?) = 2?2+ 8? 1 1. Opens up a > 0 2. y - intercept = -1 3. AoS: ? = 4. ? 2 = 2( 2)2+8 2 1 = 8 16 1 = 9 Vertex (-2,-9) 5. Plug in another point x = -1 ? 1 = 2( 1)2+8 1 1 = 2 8 1 = 7 point = (-1,-7) 2 2= 8 8 4= 2 ? 2?. Put ? 2?. Plot
1. Students will be able to graph quadratic functions of the form f(x)=ax2 +bx +c. Steps to graphing f(x)=ax2 +bx +c. 1. Determine direction of parabola by looking at a. 2. Determine the y intercept = c. Plot on graph. 3. Determine the AoS, ? = on graph 4. Find the Vertex by plugging in the AoS to the function ? on graph 5. Plug in another point into the function close to the AoS. And plot. Graph ? ? = 3?2 6? + 5 1. Opens up a > 0 2. y - intercept = 5 3. AoS: ? = 6 4. ? 1 = 3(1)2 6 1 + 5 = 3 6 + 5 = 2 Vertex (1,2) 5. Plug in another point x = 3 ? 3 = 3(3)2 6 3 + 5 = 27 18 + 5 = 14 point = (3,14) 2 3= 6 6= 1 ? 2?. Put ? 2?. Plot
1. Students will be able to graph quadratic functions of the form f(x)=ax2 +bx +c. Graph ? ? = 1 1. Opens down a < 0 2. y - intercept = -6 3. AoS: ? = 2?2+ 5? 6 5 5 2)= 1= 5 2( 1 4. ? 5 = 1 = 25 Vertex (5,6.5) 5. Plug in another point x = 2 ? 2 = 1 = 2 + 10 6 = 2 point = (2,2) 252+ 5 5 6 2+ 25 6 = 25 2+ 19 = 25 2+38 2=13 2= 6.5 222+ 5 2 6
2. Students will be able to find the maximum and minimum values of quadratic functions and describe the domain and range. The y coordinate of the vertex of a parabola is the maximum value of the function when a < 0 (because the parabola opens downward and the vertex is at the top making the vertex a maximum) or the minimum value of the function when a > 0 (because the parabola opens upward and the vertex is at the bottom making the vertex a minimum). The domain for all quadratics is all real numbers. The range is y the vertex, when a > 0 Or y the vertex, when a < 0
2. Students will be able to find the maximum and minimum values of quadratic functions and describe the domain and range. Tell whether the function ? ? = 4?2 24? 19 has a minimum value or a maximum value, then find the value. Describe the domain and range. Since a < 0, the function has a maximum value. To find the value we need to find the vertex. So what are we going to find next? The AoS ? = 2? 24 2 4 Now plug in the AoS ? 3 = 4 32 24 3 19 = 36 + 72 19 = 17 So the maximum value is 17. The domain is all real numbers. The range is y 17 ? = 24 ? = 8= 3 Vertex = (-3,17)
2. Students will be able to find the maximum and minimum values of quadratic functions and describe the domain and range. Tell whether the function ? =1 maximum value, then find the value. Describe the domain and range. 4?2+ 3? + 1 has a minimum value or a Since a > 0, the function has a minimum value. To find the value we need to find the vertex. So what are we going to find next? 3 2 1 4 ? 6 =1 4 62+ 3 6 + 1 = 9 18 + 1 = 8 So the minimum value is -8. The domain is all real numbers. The range is y -8 = 3 ? = = 6 1 2 Vertex = (-6,-8)


