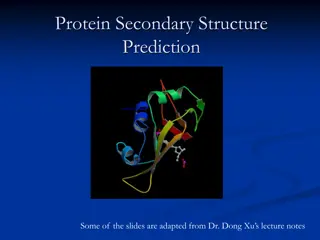
Understanding the Hierarchy of Protein Structure
To understand proteins' final shape and function, one must grasp the primary, secondary, tertiary, and quaternary structure levels. Proteins, composed of amino acids, fold into various shapes crucial for their roles such as signaling, catalysis, and structure. The primary structure represents the amino acid sequence, while the secondary structure involves alpha helices and beta sheets. Tertiary structure showcases more complex folding, and quaternary structures involve the combination of multiple protein units. Recognizing these levels aids in predicting protein function based on sequence analysis.

Download Presentation

Please find below an Image/Link to download the presentation.
The content on the website is provided AS IS for your information and personal use only. It may not be sold, licensed, or shared on other websites without obtaining consent from the author. Download presentation by click this link. If you encounter any issues during the download, it is possible that the publisher has removed the file from their server.
E N D
Presentation Transcript
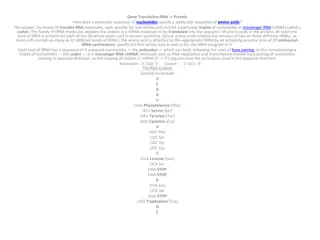
PROTEIN HIERARCHY To understand how a protein gets its final shape or conformation, we need to understand the four levels of protein structure: primary, secondary, tertiary, and quaternary. A protein s function is determined by it s 3-D structure, which in turn is determined by the specific amino acid sequence. It is this sequence which directs the folding of the protein into its major configuration. The goal then is to predict the 3-D folding of a protein given its amino acid sequence. This is done by looking for structural motifs and positions of specific secondary structures. The primary structure of a protein is its amino acid sequence. The secondary structure is the initial folding of the sequence into alpha helices and beta sheets. The tertiary structure is a more complex folding of the protein upon itself. The quarternary structure is the combination of two or more of the same protein. And finally, the supramolecular structure is the combination of several different protein subunits. It is this 3-D structure that determines the function of the protein, either for signaling, transport, catalysis, movement, structure, or regulation.
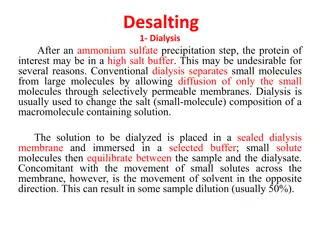
PRIMARY STRUCTURE A protein is type a polymer which is made up of a series of monomers, amino acids. There are twenty / 22 different kinds of amino acids. They can be categorized into three groups: 1) hydrophilic, 2) hydrophobic, and 3) special (Figure 1). The hydrophilic amino acids can be further categorized as either basic or acidic. Basic hydrophilic amino acids are positively charged whereas acidic hydrophilic amino acids are negatively charged, according to the polarity of the R group These twenty amino acids have distinct shapes and properties. They are joined in a sequence via peptide bonds. Peptide bonds are formed through hydrolysis between the carboxyl group of one amino acid and the amino group of another.
PROWL Collection tool for identification of primary protein structure.
SECONDARY STRUCTURE The secondary structure is the initial folding of the amino acid sequence into alpha helices and beta sheets (Figure 2).
Conti.. The polypeptide chain of a protein seldom forms just a random coil. Remember that proteins have either a chemical (enzymes) or structural function to fulfill. High specificity requires an intricate arrangement of 3-dimensional interactions and therefore a defined conformation of the polypeptide chain. The two most common secondary structure arrangements are the right-handed - helix and -sheets, which can be connected into a large tertiary structure ( or fold) by turns and loops of a variety of types. These two secondary structural elements satisfy a strong hydrogen bond network within the geometric constraints of the bond angles , . The -sheets can be formed by parallel or most common, antiparallel arrangement of individual - strands. The peptide bond has partial double bond character that forces the atoms of the polypeptide backbone to be planar. Thus, the only degrees of freedom for rotation in the polypeptide backbone are around the bonds to the C carbon- (phi) and (psi). The Ramachandran plot shows those regions of (phi) and (psi).
The Ramachandran plot A special way for plotting protein torsion angles was introduced by Ramachandran and co-authors and since then is called the Ramachandran plot. The Ramachandran plot provides a way to view the distribution of torsion angles in a protein structure and shows that the torsion angles corresponding to the two major secondary structure elements ( -helices and -sheets) are clearly clustered within separate regions. The images below correspond to two different structures of the same protein. Each dot in the plot corresponds to an amino acid, with its and angles. On the left is a structure at low resolution and on the right is a high-resolution structure.
Secondary Protein Structure Prediction Algorithm PREDATOR PSIPRED SPOMA
Secondary Protein Structure Prediction Algorithm : PREDATOR The PREDATOR Secondary Structure prediction algorithm is based on the recognition of hydrogen-bonded residues in the amino acid sequence. It uses database derived statistics on residue type occurrence in different classes of local hydrogen bonding structures. The novel feature of this method is its reliance on local pairwise alignment of the sequence to be predicted between each related sequence. sequences can be submitted to the PREDATOR server either by sending email message to predator@embl-heidelberg.de or by using web front end. The input sequence can be either FASTA,MSF or CLUSTAL format.
Secondary Protein Structure Prediction Algorithm : PSIPRED The PSIPRED method, developed at the University of Warwick, UK, uses the knowledge inferred from PSI-BLAST (Altschul et al., 1997; cf. Chapter 8) searches of the input sequence to perform predictions. PSIPRED uses two feedforward neural networks to perform the analysis on the profile obtained from PSI-BLAST. Sequences can be submitted through a simple Web front end, in either single-letter raw format or in FASTA format. The results from the PSIPRED prediction are returned as a text file in an E- mail message. In addition, a link is also provided in the E-mail message to a graphical representation of the secondary structure prediction, visualized using a Java application called PSIPRED view. In this representation, the positions of the helices and strands are schematically represented above the target sequence.
Secondary Protein Structure Prediction Algorithm : SPOMA The Protein Sequence Analysis server at the Centre National de la Recherche Scientifique (CNRS) in Lyons, France, takes a unique approach in making secondary structure predictions: rather than using a single method, it uses five, the predictions from which are subsequently used to come up with a consensus prediction. The methods used are the Garnier Gibrat Robson (GOR) method (Garnier et al., 1996), the Levin homolog method (Levin et al., 1986), the double-prediction method (Dele ageandRoux,1987),the PHD and the method of CNRS itself, called SOPMA (Geourjon and De leage, 1995) Briefly, this self-optimized prediction method builds subdatabases of protein sequences with known secondary structures; each of the proteins in a subdatabase is then subjected to secondary structure prediction based on sequence similarity. The method can be run by submitting just the sequence itself in single-letter format to deleage@ibcp.fr, using SOPMA as the subject of the mail message, or by using the SOPMAWeb interface.
Tertiary Structure Tertiary structure represents spatial arrangement of amino acids that are far apart in the linear sequence. Is results from intercations between R-group via van der Waala, ionic, hydrophobic and hydogen bonding. tertiary structure prediction methods are categorized into three major methods to model a target protein sequence. Flowchart for selecting the most accurate prediction algorithm/method among these three categories for the target sequence is schematically represented in Fig. 1.
Ab initio folding This method is simply based on elementary fundamentals of energy and geometry. Ab initio structure prediction seeks to predict the native conformation of a protein from the amino acid sequence alone. Ab initio prediction of protein structures makes no use of information available in databases mainly PDB. The goal of this method is to predict the structure of a protein based entirely on the laws of physics and chemistry. It is assumed that the actual native state of a protein sequence has the lowest free energy. It means that the protein native state conformation is basically a model at the global minima of the energy landscape. Hence, ab initio algorithm actually searches the entire possible conformational space of a target sequence, in order to find the native state among all conformations. Currently, the accuracy of ab initio modeling is limited to small proteins having length less than 50 amino acid residues. Ab initio structure prediction requires an efficient potential function to find the conformation of the modeled protein near to native state protein structure with lowest free energy.
Fold recognition Fold Recognition (FR) was reserved for methods which did not rely on sequence searching and where the sequence identity between target and template was below the so-called twilightzone spanning between 25 30 %. The rationale behind the threading method is that total number of experimentally solved 3D structure deposited in PDB database doesn t have a new fold. Using fold recognition or threading, we are able to identify proteins with known structures that share common folds with the target sequences. Fold recognition methods work by comparing each target sequence against a library of potential fold templates using energy potentials and/or other similarity scoring methods. For such comparison, we first need to define a library of potential folds. Once the library is defined, the target sequence will be fitted into each library entry and an energy function is used to evaluate the fit between the target sequence and the library entries to determine the best possible templates. The template with the lowest energy score is then assumed to best fit the fold of the target protein. The main limitation of this method is high computational cost, since each entry in the whole library of thousands of possible folds needs to be aligned in all possible ways to select the fold(s). Another major bottleneck is the energy function used for the evaluation of alignment. It is not reasonable to expect to find the correct folds in all cases with a single form of energy function.
Homology modeling Comparative or homology protein structure modeling builds a three-dimensional model for a protein of unknown structure (the target) based on one or more related proteins of known structure. The necessary conditions for getting a useful model are (a) Detectable similarity (Greater than or equal to 30 %) between the target sequence and the template structures and (b) Availability of a correct alignment between them.
Homology modeling is a multistep process 1. Template searching, selection and alignment 2. Alignment correction in core regions 3. Backbone, loop and side-chain medeling 4. Model refinement 5. Model evaluation or refinement 6. Homology model repositories
Template searching, selection and alignment Template search is generally done by comparing the target sequence with the sequence of each of the structures in the PDB database. The performance depends on the sensitivity of the comparison of target and template sequences by various programmes e.g. FASTA http://www.ebi.ac.uk/Tools/sss/fasta/ while, BLAST and PSI-BLAST (Altschul et al. 1997) are available at http://blast. ncbi.nlm.nih.gov/Blast.cgi. The simplest template selection rule is to select the structure with the highest sequence similarity with the target sequence. The quality of a template increases with its overall sequence similarity with the target and decreases with the number and length of gaps in the alignment which is available at
Conti. Multiple sequence alignment by various freely available programmes e.g. ClustalW Mufft (Katoh et al. 2002), Kalign (Lassmann and Sonnhammer 2005), Probcons (Do et al. 2005) etc. and a development of phylogenetic tree by freely available programmes e.g. MEGA (Tamura et al. 2013) and PHYLIP etc. can help in selecting the template from the subfamily that is closest to the target sequence. HHpred (http://toolkit.tuebingen.mpg.de/hhpred) is one of the best servers which can even detect very distant relationships between the target sequence and the solved PDB structures significantly. This is the first server that is based on the pairwise comparison of profile Hidden Markov Models (HMMs). The similarity between the environment of the template and the environment in which the target needs to be modeled should also be considered.
Alignment correction in core region An accurate alignment can be calculated automatically using standard sequencesequence alignment methods, (http://blast.ncbi.nlm.nih.gov/ Blast.cgi) and dynamic programming based Needle global sequence alignment. In low sequence identity cases, the alignment accuracy is the most important factor which affects the quality of the predicted model. Alignments can be improved by including structural information from the template protein structure. Gaps should be avoided in core regions mainly in secondary structure elements (which are found to be conserved in most cases), buried regions and between two residues that are far in space. It is important to inspect and edit the alignment manually by many tools e.g. Bioedit (www.mbio. ncsu.edu/bioedit/bioedit.html) etc., especially if the target-template sequence identity is low. for example, Blast2seq
Backbone, loop, side chain refinement Creating the backbone is essential for modeled protein structure. For backbone, we simply copy the coordinates of those template residues that show up in the alignment with the model sequence. If two aligned residues differ, only the backbone coordinates (N, C , C and O) can be copied. If they are the same, we can also include the coordinates of side chain amino acid residues. There are two main classes of loop modeling methods: (a) Database search approaches, where a small loop of 3 10 amino acid residues are searched in a database of known protein structures and if such loops fit the criteria of lowest energy, such loops are selected and added to the model structure. All major molecular modeling programs and servers support this approach e.g. Modeller ( ali and Blundell 1993), Swiss-Model (Guex and Peitsch 1997). (b) The conformational search approaches mainly depend on an efficient energy function to choose the loop with lowest energy. If required, energy of the selected loop is minimized using Monte Carlo or molecular dynamics simulations by AMBER, and GROMACS techniques in order to arrive at the best loop conformation with lowest energy. Side chain modeling is also one of the essential components in structure prediction of proteins. When we compare the side-chain conformations (rotamers) of residues that are conserved in structurally similar proteins, we copy coordinates of conserved amino acid residues entirely from the template to the model. But when we have different residues, side chains are added to each amino acid and their all possible rotamers are searched to find the most stable (having least energy) rotamer from rotamer library.
Model refinement There are various programmes e.g. GROMACS (http://www.gromacs.org/), (www.amber.scripps.edu), and CHARMM (http:// www.charmm.org/) which are freely as well commercially available for protein model refinement by correcting the overall protein structural geometry. One of the recently developed refinement methods called 3Drefine is computationally inexpensive and consumes only few minutes of CPU time to refine a protein of typical length of 300 amino acid residues (Bhattacharya and Cheng 2013). AMBER
Model evaluation or refinement The predicted model must be checked for (a) Errors or distortion in side chain packing of the modeled structure. (b) Distortions or shifts in correctly aligned region of target with the template structures. (c) Distortions or shifts of a region that does not align with any of the template structures. (d) Distortions or shifts of a region that is aligned incorrectly with the template structures.
Homology model repositories there are many repositories available, which contain protein homology models generated using various automated methods that provide models which serve as starting points for biologists/experimentalists. SWISS-MODEL repository (http://swissmodel.expasy.org/repository/) is one of the databases of annotated three-dimensional comparative protein structure models generated by the fully automated homology-modelling pipeline SWISS-MODEL. Protein Model Portal (http://proteinmodelportal.org) is another repository aimed at storing manually built 3D models of proteins (Arnold et al. 2009). The most recent database is Modbase (http://modbase.compbio.ucsf.edu) which contains the datasets of comparative protein structure models, calculated by modeling pipeline ModPipe (Pieper et al. 2011).