Freshman Survey 2013 Results at University of Scranton
The University of Scranton's CIRP Freshman Survey for first-time, full-time freshmen in 2013 gathered crucial data on the incoming students' profiles, including demographics, high school experiences, college admissions decisions, financing, expectations for college life and career, and more. The survey delves into various aspects of the college experience to help understand and support students better.

Download Presentation

Please find below an Image/Link to download the presentation.
The content on the website is provided AS IS for your information and personal use only. It may not be sold, licensed, or shared on other websites without obtaining consent from the author. Download presentation by click this link. If you encounter any issues during the download, it is possible that the publisher has removed the file from their server.
E N D
Presentation Transcript
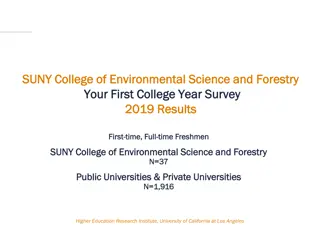
University of Scranton CIRP Freshman Survey 2013 Results First-time, Full-time Freshmen University of Scranton N=192 Catholic 4yr Colleges-high selectivity N=6,167 Higher Education Research Institute, University of California at Los Angeles Return to contents
INCOMING FIRST YEAR STUDENTS The First Year is Important The CIRP Freshman Survey (TFS) collects important information on what your incoming students are like before they experience college. Key sections of the survey examine: College admissions decisions Financing college High school experiences and behaviors Knowledge, skills and abilities Expectations for college major and career Expectations for college life Return to contents 2
Table of Contents Demographics Sex and Race/Ethnicity Distance from Home Type of High School High School Experience Academic Preparation Habits of Mind Construct Pluralistic Orientation Academic Self-Concept Civic Engagement Health and Wellness College Admissions Decisions College Applications Accepted/Attending First Choice Reasons for Attending College Reasons for Attending This College Knowledge, Skills and Abilities Financing College Economic Situation Educational Expenses Ability to Finance Education Expectations for College Major and Career Expectations for College Life Return to contents 3
A Note about CIRP Constructs We use the CIRP Constructs throughout this PowerPoint to help summarize important information about your students from the TFS. Constructs statistically aggregate the results from CIRP questions that tap into key aspects of the college experience. They focus on student traits and institutional practices contributing to students academic and social development. Return to contents 4
Demographics Race/Ethnicity Sex 100% 90% 80.2% 80% 70% 25.5% 60% 50% 74.5% 40% 30% 20% 10.9% 10% 3.6% Male 3.1% 1.0% 0.5% 0.5% 0% Female African American/ Black American Indian/ Alaska Native Asian/ Native Hawaiian/ Pacific Islander Latino White/ Caucasian Other Race/ Ethnicity Two or More Races/ Ethnicities Return to contents 5
Demographics How many miles is this college from your permanent home? 100% 90% 80% 70% 61.5% 60% 50% 40% 30.5% 30% 23.4% 18.7% 18.2% 17.5% 20% 7.8% 10% 6.2% 5.7% 4.7% 3.7% 2.1% 0% 5 or less 6-10 11-50 51-100 101-500 Over 500 Your Institution Comparison Group Return to contents 6
Demographics From what kind of high school did you graduate? 100% 90% 80% 70% 59.9% 57.0% 60% 50% 40% 28.4% 27.6% 30% 20% 12.5% 11.1% 10% 1.5% 1.1% 1.0% 0.0% 0.0% 0.0% 0% Public school (not charter or magnet) Public charter school Public magnet school Private Private independent college-prep school Home school religious/parochial school Your Institution Comparison Group Return to contents 7
College Admissions Decisions Many factors impact incoming students college choice, including the benefits they see in attending college and considerations about which specific college to attend. Return to contents
College Admissions Decisions To how many colleges other than this one did you apply for admission this year? 100% 90% 80% 70% 60% 50% 37.5% 40% 29.3% 30% 20% 13.5% 11.3% 11.0% 10.9% 10.9% 10.4% 9.8% 9.5% 9.4% 7.8% 7.1% 10% 6.4% 5.2% 4.8% 2.6% 2.6% 0% None 1 2 3 4 5 6 7-10 11 or more Your Institution Comparison Group Return to contents 9
College Acceptance Is this collegeyour 100% 90% Were you accepted by your first choice college? 80% 67.2% 70% 58.0% 60% 50% 40% 20.9% 27.0% 30% 20.3% 20% 10.2% 9.9% 79.1% 10% 4.8% 2.6% 0% First Choice Second Choice Third Choice Less than Third Choice Yes No Your Institution Comparison Group Return to contents 10
College Choice In deciding to go to college, how important to you was each of the following reasons? 100% 90% 80% 70% 51.5% 75.0% 71.2% 60% 63.5% 79.7% 78.6% 88.2% 92.2% 50% 40% 30% 20% 39.4% 28.1% 25.2% 23.3% 10% 19.3% 19.3% 10.5% 7.3% 0% To be able to get a better job To gain a general education and appreciation of ideas To make me a more cultured person To be able to make more money Your Institution Very Important Very Important Somewhat Important Somewhat Important Comparison Group Return to contents 11
College Choice In deciding to go to college, how important to you was each of the following reasons? 100% 90% 80% 70% 60% 73.3% 58.3% 83.3% 71.4% 84.9% 85.4% 50% 40% 30% 20% 29.2% 22.7% 21.4% 10% 15.7% 14.6% 13.5% 0% To learn more about things that interest me To get training for a specific career To prepare myself for graduate or professional school Your Institution Very Important Very Important Somewhat Important Somewhat Important Comparison Group Return to contents 12
College Choice How important was each reason in your decision to attend this college? 100% 90% 80% 70% 49.7% 56.5% 66.1% 75.1% 38.0% 42.4% 52.4% 60% 80.1% 45.7% 72.8% 50% 40% 30% 41.5% 40.3% 20% 39.1% 36.0% 35.5% 34.1% 28.2% 23.1% 21.2% 10% 18.3% 0% This college has a very good academic reputation This college has a good reputation for its social activities This college s graduates gain admission to top graduate/professional schools The percentage of students that graduate from this college This college s graduates get good jobs Your Institution Very Important Very Important Somewhat Important Somewhat Important Comparison Group Return to contents 13
College Choice How important was each reason in your decision to attend this college? 100% 90% 80% 70% 42.5% 60% 36.9% 62.9% 61.1% 50% 40% 30% 12.6% 10.9% 10.4% 20% 39.8% 38.2% 11.2% 22.9% 22.6% 10% 17.5% 15.9% 15.8% 12.1% 0% I was offered financial assistance The cost of attending this college Not offered aid by first choice Could not afford first choice Your Institution Very Important Very Important Somewhat Important Somewhat Important Comparison Group Return to contents 14
College Choice How important was each reason in your decision to attend this college? 100% 90% 80% 70% 23.2% 56.6% 60% 72.8% 23.7% 20.0% 19.6% 50% 16.8% 20.3% 40% 30% 51.4% 46.9% 45.2% 42.8% 20% 33.7% 33.2% 31.4% 22.8% 10% 0% My parents wanted me to come here I wanted to live near home Rankings in national magazines A visit to the campus Your Institution Very Important Very Important Somewhat Important Somewhat Important Comparison Group Return to contents 15
Financing College Economic factors play an important role in students decisions about college. Return to contents
Financing College The current economic situation significantly affected my college choice. 100% 90% 80% 70% 60% 50% 42.6% 41.9% 40% 28.4% 30% 23.7% 20.7% 20.0% 20% 13.7% 8.9% 10% 0% Agree Strongly Agree Somewhat Disagree Somewhat Disagree Strongly Your Institution Comparison Group Return to contents 17
Financing College The percentage of students with at least some funds from these various sources. 84.9% Family resources 86.5% 63.6% Personal resources 66.7% 82.4% Aid not to be repaid 80.5% 69.9% Aid to be repaid 59.0% 9.3% Other sources 8.1% 0% 10% 20% 30% 40% 50% 60% 70% 80% 90% 100% Your Institution Comparison Group Return to contents 18
Financing College Do you have any concern about your ability to finance your college education? 100% 90% 80% 70% 61.8% 55.8% 60% 50% 40% 32.2% 25.7% 30% 20% 12.6% 12.0% 10% 0% None Some Major Your Institution Comparison Group Return to contents 19
High School Experiences Understanding students established behaviors in high school helps foster skills, knowledge and abilities in the curriculum and co-curriculum. Return to contents
High School Experiences How many Advanced Placement courses did you take in high school? 100% 90% 80% 70% 60% 54.5% 48.4% 50% 40% 32.6% 30% 19.1% 18.6% 16.3% 20% 6.3% 10% 1.6% 1.1% 1.1% 0.3% 0.0% 0% Not offered at my high school None 1-4 5-9 10-14 15+ Your Institution Comparison Group Return to contents 21
High School Experiences How many Advanced Placement exams did you take in high school? 100% 90% 80% 70% 60% 52.0% 50% 42.1% 40.0% 40% 30% 24.9% 15.8% 15.3% 20% 6.3% 10% 1.6% 1.1% 0.7% 0.2% 0.0% 0% Not offered at my high school None 1-4 5-9 10-14 15+ Your Institution Comparison Group Return to contents 22
High School Experiences Which of the following math courses did you complete in high school? 99.5% 98.0% 100% 89.6% 88.9% 90% 80% 70% 60% 50% 40% 35.1% 31.9% 29.8% 29.4% 30% 23.7% 17.4% 20% 15.4% 8.4% 10% 0% Algebra II Pre-Calculus/Trigonometry Probability & Statistics Calculus AP Probability & Statistics AP Calculus Your Institution Comparison Group Return to contents 23
High School Experiences Have you had any special tutoring or remedial work in any of the following subjects? 100% 90% 80% 70% 60% 50% 40% 28.1% 30% 22.8% 22.4% 20.3% 20.3% 18.8% 17.7% 20% 15.1% 10.7% 10.1% 9.4% 9.2% 9.0% 6.7% 10% 0% English Reading Mathematics Social Studies Science Foreign Language Writing Your Institution Comparison Group Return to contents 24
High School Experiences Do you feel you will need any special tutoring or remedial work in any of the following subjects? 100% 90% 80% 70% 60% 50% 40% 30% 25.2% 24.0% 20% 16.1% 14.4% 13.9% 13.6% 13.5% 10.4% 9.4% 9.4% 9.4% 10% 5.4% 4.7% 3.9% 0% English Reading Mathematics Social Studies Science Foreign Language Writing Your Institution Comparison Group Return to contents 25
Habits of Mind Habits of Mind is a unified measure of the behaviors and traits associated with academic success. These learning behaviors are seen as the foundation for lifelong learning. 60 Construct Items 58 Support your opinions with a logical argument Seek solutions to problems and explain them to others Seek alternative solutions to a problem Evaluate the quality or reliability of information you received Ask questions in class Take a risk because you felt you had more to gain Seek feedback on academic work Explore topics on your own, even though it was not required for a class Accept mistakes as part of the learning process Revise your papers to improve your writing Look up scientific research articles and resources 56 53.0 54 51.8 51.4 51.2 51.1 51.1 52 50 48 46 44 42 40 All FTFT Men Women Your Institution Comparison Group Return to contents 26
Pluralistic Orientation Pluralistic Orientation measures skills and dispositions appropriate for living and working in a diverse society. 60 58 Construct Items 56 Tolerance of others with different beliefs Ability to work cooperatively with diverse people Ability to discuss and negotiate controversial issues Openness to having my views challenged Ability to see the world from someone else's perspective 54 52.5 52 50.4 50.2 50.0 49.7 49.5 50 48 46 44 42 40 All FTFT Men Women Your Institution Comparison Group Return to contents 27
Academic Self-Concept Self-awareness and confidence in academic environments help students learn by encouraging their intellectual inquiry. Academic Self-Concept is a unified measure of students beliefs about their abilities and confidence in academic environments. 60 58 56 54 Construct Items 51.2 51.1 52 Self-rated academic ability Self-rated mathematical ability Self-rated self-confidence (intellectual) Self-rated drive to achieve 49.4 50 48.7 48.1 47.8 48 46 44 42 40 All FTFT Men Women Your Institution Comparison Group Return to contents 28
Civic Engagement Engaged citizens are a critical element in the functioning of our democratic society. Civic Engagement measures the extent to which students are motivated and involved in civic, electoral and political activities. 60 58 Construct Items 56 Publicly communicated your opinion about a cause I am interested in seeking information about current social and political issues Worked on a local, state, or national political campaign Demonstrated for a cause Keeping up to date with political affairs Influencing social values Helped raise money for a cause or campaign Performed volunteer work 54 51.7 51.0 50.9 52 50.5 50.3 49.8 50 48 46 44 42 40 All FTFT Men Women Your Institution Comparison Group Return to contents 29
Health and Wellness Students physical and emotional well-being can affect many important aspects of the student experience including academic performance and persistence. These items gauge student behaviors, attitudes and experiences related to health and wellness. 100% 90% 80% 33.3% 35.1% 70% 60% 50% 6.3% 7.3% 40% 60.9% 30% 56.7% 46.4% 20% 37.6% 10% 0% Felt overwhelmed by all you had to do Felt depressed Your Institution Comparison Group Frequently Frequently Occasionally Occasionally Return to contents 30
Knowledge, Skills and Abilities These items illustrate students views of their academic skills and abilities. Return to contents
Knowledge, Skills and Abilities Think about your current abilities and tell us how strong or weak you believe you are in each of the following areas: 100% 90% 80% 70% 24.5% 25.4% 60% 30.2% 22.2% 50% 40% 30% 11.3% 53.5% 48.7% 10.6% 46.9% 42.9% 20% 21.7% 10% 18.5% 0% General knowledge Knowledge of a particular field or discipline Foreign language ability Your Institution Comparison Group A Major Strength A Major Strength Somewhat Strong Somewhat Strong Return to contents 32
Knowledge, Skills and Abilities Think about your current abilities and tell us how strong or weak you believe you are in each of the following areas: 100% 90% 80% 70% 60% 50% 12.3% 40% 14.3% 11.7% 10.2% 30% 8.5% 12.2% 20% 35.4% 31.3% 30.7% 28.3% 25.9% 23.3% 10% 0% Understanding of the problems facing your community Understanding of national issues Understanding of global issues Your Institution Comparison Group A Major Strength A Major Strength Somewhat Strong Somewhat Strong Return to contents 33
Knowledge, Skills and Abilities Think about your current abilities and tell us how strong or weak you believe you are in each of the following areas: 100% 90% 80% 70% 60% 26.0% 33.3% 23.0% 50% 21.2% 40% 30% 46.8% 42.2% 20% 39.2% 38.1% 10% 0% Critical thinking skills Problem-solving skills Your Institution Comparison Group A Major Strength A Major Strength Somewhat Strong Somewhat Strong Return to contents 34
Knowledge, Skills and Abilities Think about your current abilities and tell us how strong or weak you believe you are in each of the following areas: 100% 90% 80% 70% 52.9% 47.4% 60% 50% 12.5% 40% 14.8% 30% 20% 36.6% 34.0% 33.9% 30.2% 10% 0% Knowledge of people from different races/cultures Ability to get along with people of different races/cultures Your Institution Comparison Group A Major Strength A Major Strength Somewhat Strong Somewhat Strong Return to contents 35
Knowledge, Skills and Abilities Think about your current abilities and tell us how strong or weak you believe you are in each of the following areas: 100% 90% 80% 70% 60% 34.9% 30.4% 50% 23.8% 27.5% 21.9% 20.7% 40% 30% 20% 37.6% 37.4% 36.5% 35.5% 35.0% 33.3% 10% 0% Ability to manage your time effectively Interpersonal skills Leadership abilities Your Institution Comparison Group A Major Strength A Major Strength Somewhat Strong Somewhat Strong Return to contents 36
Expectations for College: Major and Career Understanding students intended majors and career aspirations helps them plot an intentional and meaningful course of study. Return to contents
Expectations: Major Please indicate your intended major. Your Inst Comp Group Your Inst Comp Group Fine Arts Agriculture 0.0% 0.1% 0.0% 1.0% Biological & Life Sciences Mathematics or Computer Science 21.9% 11.8% 2.1% 2.8% Business Physical Science 16.1% 20.9% 1.6% 1.8% Education Social Science 3.6% 5.5% 6.8% 7.8% Engineering Justice and Security 0.5% 10.1% 4.2% 0.3% English Library Science 1.0% 2.0% 0.0% 0.0% Health Professions Other Non-technical 27.6% 11.6% 1.0% 1.2% History or Political Science Arts & Humanities Undecided 1.0% 4.0% 6.8% 13.5% 5.7% 5.6% Return to contents 38
Expectations: Major Do you consider yourself Pre-Med or Pre-Law? 100% 90% 80% 70% 60% 50% 40% 26.8% 30% 17.4% 20% 6.7% 10% 5.3% 0% Pre-Med Pre-Law Your Institution Comparison Group Return to contents 39
Expectations: Career Please indicate your intended career. Your Inst Comp Group Your Inst Comp Group Health Professional Agriculture/Natural Resources Artist 0.0% 0.5% 17.3% 7.6% Homemaker/Stay-at-Home Parent 1.0% 4.3% 0.0% 0.8% Business Information Technology Professional 14.1% 19.5% 0.0% 1.8% Business (Admin Assistant) Lawyer 0.5% 0.2% 2.1% 3.5% Clergy Military 1.0% 0.3% 0.5% 1.2% College Faculty Nurse 0.5% 0.3% 8.4% 4.0% Communications Research Scientist 5.2% 2.7% 5.8% 2.5% Doctor (MD or DDS) Service Industry 14.7% 9.2% 0.0% 0.2% Education (Elementary/Secondary) Engineer Skilled Worker 5.8% 6.3% 0.0% 0.2% Social /Non-Profit Services 0.0% 8.5% 0.0% 2.7% Government Other 2.1% 2.3% 9.9% 7.8% Undecided 11.0% 13.7% Return to contents 40
Expectations: Time to Degree How many years do you expect it will take you to graduate from this college? 100% 92.7% 86.3% 90% 80% 70% 60% 50% 40% 30% 20% 10% 6.0% 6.0% 4.4% 1.6% 1.3% 0.9% 0.4% 0.3% 0.1% 0.0% 0.0% 0.0% 0% 1 2 3 4 5 6+ Do not plan to graduate from this college Your Institution Comparison Group Return to contents 41
Expectations: Degree Aspirations What is the highest academic degree that you intend to attain? 100% 90% 80% 70% 60% 48.8% 50% 41.6% 40% 30% 20.0% 19.8% 17.4% 20% 15.3% 14.9% 9.5% 10% 5.0% 2.6% 1.1% 1.1% 1.1% 0.5% 0.5% 0.4% 0.4% 0.1% 0.1% 0.0% 0% None Vocational certificate Associate (A.A. or equivalent) Bachelor's degree (B.A., B.S., etc.) Master's degree (M.A., M.S., etc.) Ph.D. or Ed.D. M.D., D.O., D.D.S., D.V.M. J.D. (Law) B.D. or M.DIV. (Divinity) Other Your Institution Comparison Group Return to contents 42
Expectations for College Life Understanding students expectations helps provide opportunities for students to grow intellectually, interpersonally and affectively. Return to contents
Expectations for College Life What is your best guess as to the chances that you will: 100% 90% 80% 70% 62.4% 58.4% 56.9% 45.6% 60% 45.5% 48.6% 50% 40% 30% 40.5% 20% 36.5% 36.5% 36.0% 35.4% 30.7% 10% 0% Participate in volunteer or community service work Participate in a study abroad program Discuss course content with students outside of class Your Institution Very Good Chance Very Good Chance Some Chance Some Chance Comparison Group Return to contents 44
Expectations for College Life What is your best guess as to the chances that you will: 100% 90% 80% 70% 53.9% 65.7% 41.0% 29.5% 60% 50% 40% 30% 48.3% 5.6% 44.4% 40.9% 20% 4.0% 33.1% 20.8% 10% 17.1% 0% Take a course exclusively online at this institution Work on a professor s research project Communicate regularly with your professors Your Institution Very Good Chance Very Good Chance Some Chance Some Chance Comparison Group Return to contents 45
Expectations for College Life What is your best guess as to the chances that you will: 100% 90% 80% 70% 60% 50% 40% 30% 3.9% 5.6% 20% 2.9% 21.6% 10% 20.3% 3.4% 1.8% 14.1% 2.2% 8.4% 6.8% 4.5% 0% Need extra time to complete your degree requirements Take a leave of absence from this college temporarily Transfer to another college before graduating Your Institution Very Good Chance Some Chance Comparison Group Very Good Chance Some Chance Return to contents 46
The more you get to know your students, the better you can understand their needs. For more information about HERI/CIRP Surveys The Freshman Survey Your First College Year Survey Diverse Learning Environments Survey College Senior Survey The Faculty Survey Please contact: heri@ucla.edu (310) 825-1925 www.heri.ucla.edu Return to contents 47