Staff Climate Survey 2018-2019 Results at Sample University: Insights and Findings
The Staff Climate Survey at Sample University provides crucial insights into the campus climate, staff demographics, satisfaction levels, and sources of stress among staff members in postsecondary institutions. The survey assesses aspects such as workplace satisfaction, discrimination issues, and overall satisfaction with work-life balance. Results from the survey shed light on staff perspectives on campus diversity, atmosphere, and professional development opportunities.

Download Presentation

Please find below an Image/Link to download the presentation.
The content on the website is provided AS IS for your information and personal use only. It may not be sold, licensed, or shared on other websites without obtaining consent from the author. Download presentation by click this link. If you encounter any issues during the download, it is possible that the publisher has removed the file from their server.
E N D
Presentation Transcript
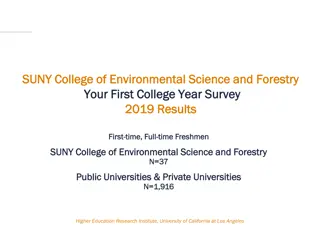
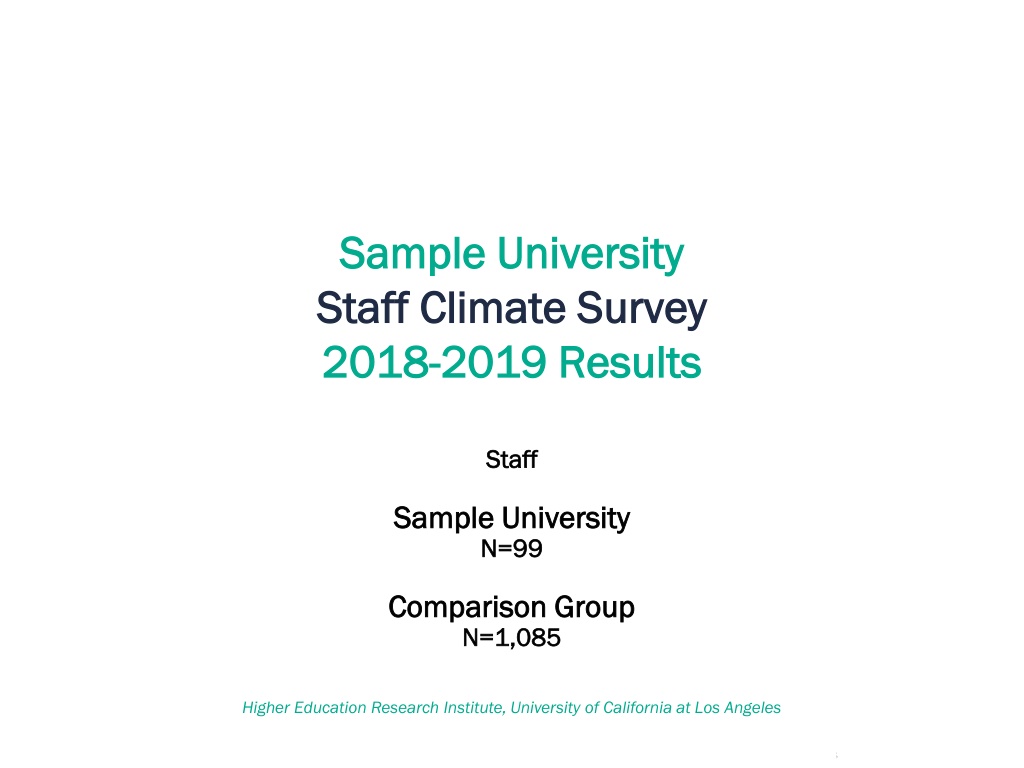
Sample University Sample University Staff Climate Survey Staff Climate Survey 2018 2018- -2019 Results 2019 Results Staff Staff Sample University Sample University N=99 N=99 Comparison Group Comparison Group N=1,085 N=1,085 Higher Education Research Institute, University of California at Los Angeles Return to Table of Contents Return to Table of Contents
THE STAFF EXPERIENCE College Senior Survey Results from the Staff Climate Survey assess Results from the Staff Climate Survey assess the campus climate from the staff perspective. the campus climate from the staff perspective. The survey also touches on staff s level of The survey also touches on staff s level of stress, satisfaction with their institution, and stress, satisfaction with their institution, and work work- -related experiences as staff members in related experiences as staff members in postsecondary institutions. postsecondary institutions. Staff Demographics Satisfaction and Sources of Stress Perspectives of Campus Climate Work Environment Return to Table of Contents Return to Table of Contents
Table of Contents Demographics Demographics Campus Climate Campus Climate Staff Roles & Years Employed Staff Roles & Years Employed Employment Status & Campus Unit Employment Status & Campus Unit Direct Reports & Education Direct Reports & Education Race/Ethnicity Race/Ethnicity Gender Identity Gender Identity Sexual Orientation Sexual Orientation Campus Atmosphere Campus Atmosphere Campus Diversity Campus Diversity Staff Perspectives on Campus Climate Staff Perspectives on Campus Climate Campus Community & Diversity: Institutional Campus Community & Diversity: Institutional Priorities Priorities Staff Staff Discrimination or Exclusion Discrimination or Exclusion Discrimination and Harassment Discrimination and Harassment Satisfaction w/ Administrative Satisfaction w/ Administrative Responses Responses Staff Satisfaction & Sources of Stress Staff Satisfaction & Sources of Stress Workplace Satisfaction Workplace Satisfaction Workplace & Overall Satisfaction Workplace & Overall Satisfaction Satisfaction with Work Satisfaction with Work- -Life Balance Satisfaction Satisfaction with Benefits & Compensation with Benefits & Compensation Sources of Stress Sources of Stress Work Environment Work Environment Life Balance Supervisors Supervisors Professional Development Professional Development Return to Table of Contents 2019 Staff Climate Survey 3 Return to Table of Contents
Demographics Return to Table of Contents Return to Table of Contents
Demographics Demographics Years Employed: Role 50% 2.9% 1.4% 45% 43.0% 40% 17.4% 36.2% 35% 30% 25% 20.0% 18.6% 20% 17.6% 78.3% 13.4% 15% 12.5% 12.1% 10% 7.4% 7.3% 7.2% 4.7% 5% Senior administrator Mid-level administrator/manager Staff Other 0% Less than 1 year 1-4 years 5-10 years 11-15 years 16-20 years More than 20 years At this institution In your current position Return to Table of Contents 2019 Staff Climate Survey 5 Return to Table of Contents
Demographics Demographics Employment Campus Unit (Aggregated) 100% 6.9%3.1% 0.0% 90% 80% 70% 60% 50% 35.4% 40% 30.8% 90.0% 30% 23.1% 20% 10% 4.6% 3.8% 2.3% Full-time, permanent 0% Full-time, temporary/contract Part-time, permanent Part-time, temporary/contract Return to Table of Contents 2019 Staff Climate Survey 6 Return to Table of Contents
Demographics Demographics Number of Direct Reports Highest Level of Education Doctoral or professional degree 7.0% 6.1%2.3% Master's degree 34.2% 9.2% Bachelor's degree 43.9% Associate's degree 3.5% 60.3% 22.1% Technical certificate 1.8% Some college 6.1% I do not directly supervise employees 1 to 2 High school graduate/GED 3.5% 0% 10% 20% 30% 40% 50% 3 to 5 6 to 10 11 or more Return to Table of Contents 2019 Staff Climate Survey 7 Return to Table of Contents
Demographics Demographics Race/Ethnicity 100% 90% 79.4% 80% 67.5% 70% 60% 50% 40% 30% 20% 9.4% 7.6% 10% 5.3% 4.9% 4.6% 4.6% 4.1% 3.8% 3.8% 2.3% 2.2% 0.3% 0.0% 0.0% 0.0% 0.0% 0% Your Institution All Institutions Return to Table of Contents 2019 Staff Climate Survey 8 Return to Table of Contents
Demographics Demographics Gender Identity 80% 67.2% 70% 66.7% 60% 50% 40% 32.9% 32.1% 30% 20% 10% 0.1% 0.0% 0.0% 0.0% 0% Man/Trans man Woman/Trans woman Genderqueer/ Gender non- conforming Different identity Your institution All Institutions Return to Table of Contents 2019 Staff Climate Survey 9 Return to Table of Contents
Demographics Demographics How do you self-identify? 100% 94.5% 92.2% 90% 80% 70% 60% 50% 40% 30% 20% 10% 3.1% 1.8% 1.6% 1.6% 1.4% 0.8% 0.8% 0.7% 0.6% 0.5% 0.3% 0.3% 0.0% 0.0% 0% Your Institution All Institutions Return to Table of Contents 2019 Staff Climate Survey 10 Return to Table of Contents
Satisfaction & Stress Return to Table of Contents Return to Table of Contents
Workplace Satisfaction Workplace Satisfaction (% Indicating Satisfied or Very Satisfied ) (% Indicating Satisfied or Very Satisfied ) 100% 90% 80% 70% 60% 50% 40% 81.0% 80.1% 76.1% 75.9% 75.2% 74.8% 73.4% 71.9% 30% 47.5% 46.6% 42.7% 20% 39.6% 10% 0% Collegiality among staff Competence of colleagues Professional relationships w/ colleagues Relationship with my supervisor Prospects for career advancement Support for career advancement Your Institution All Institutions Return to Table of Contents 2019 Staff Climate Survey 12 Return to Table of Contents
Workplace & Overall Satisfaction Workplace & Overall Satisfaction (% Indicating Satisfied or Very Satisfied ) (% Indicating Satisfied or Very Satisfied ) 100% 90% 80% 70% 60% 50% 80.4% 80.3% 80.3% 80.3% 40% 76.0% 75.1% 72.4% 68.8% 30% 20% 10% 0% Workspace Autonomy and independence Job security Overall job satisfaction Your Institution All Institutions Return to Table of Contents 2019 Staff Climate Survey 13 Return to Table of Contents
Work Work- -Life Balance Life Balance (% Indicating Agree or Strongly Agree ) (% Indicating Satisfied or Very Satisfied ) 100% 100% 90% 90% 80% 80% 70% 70% 60% 60% 50% 50% 86.4% 85.5% 40% 40% 74.8% 70.9% 71.7% 68.2% 65.0% 63.8% 30% 30% 20% 20% 10% 10% 0% 0% Departmental support for work-life balance Flexibility in relation to family matters or emergencies Institutional support for work-life balance I achieve a healthy balance between my personal life & my professional life Your Institution All Institutions Your Institution All Institutions Return to Table of Contents 2019 Staff Climate Survey 14 Return to Table of Contents
Satisfaction with Benefits & Compensation Satisfaction with Benefits & Compensation (% Indicating Satisfied or Very Satisfied ) (% Indicating Satisfied or Very Satisfied ) 100% 90% 80% 70% 60% 50% 40% 79.7% 77.8% 73.7% 72.6% 68.4% 63.9% 30% 60.6% 48.3% 45.2% 42.7% 42.0% 20% 37.3% 10% 0% Relative equity of salary & job benefits Quality of health benefits Cost of health benefits Retirement benefits Salary Extended leave policies Your Institution All Institutions Return to Table of Contents 2019 Staff Climate Survey 15 Return to Table of Contents
Sources of Stress Sources of Stress (% Indicating Somewhat or Extensive ) (% Indicating Somewhat or Extensive ) 100% 90% 80% 70% 60% 50% 40% 70.3% 67.2% 64.5% 30% 59.2% 47.4% 20% 41.6% 35.9% 33.3% 10% 19.3% 15.5% 0% Discrimination (e.g., prejudice, racism, sexism, homophobia, transphobia) Review/promotion process Institutional procedures and red tape Increasing work responsibilities Budget cuts in your department/unit Your Institution All Institutions Return to Table of Contents 2019 Staff Climate Survey 16 Return to Table of Contents
Sources of Stress: Sources of Stress: (% Indicating Somewhat or Extensive ) (% Indicating Somewhat or Extensive ) 100% 90% 80% 70% 60% 50% 40% 72.6% 72.4% 30% 61.3% 59.3% 57.3% 57.0% 52.8% 52.2% 49.4% 49.3% 20% 31.5% 30.7% 10% 0% Your Institution All Institutions Return to Table of Contents 2019 Staff Climate Survey 17 Return to Table of Contents
Campus Climate Return to Table of Contents Return to Table of Contents
Campus Atmosphere Campus Atmosphere (% Indicating Satisfied or Very Satisfied ) (% Indicating Satisfied or Very Satisfied ) Staff Satisfaction with the Atmosphere for: 100% 90% 80% 70% 60% 50% 40% 30% 57.1% 56.1% 54.1% 52.7% 50.0% 49.6% 48.0% 47.6% 46.8% 45.6% 20% 10% 0% Sexual orientation differences Political differences Religious differences Gender differences Individuals with disabilities Your Institution All Institutions Return to Table of Contents 2019 Staff Climate Survey 19 Return to Table of Contents
Campus Diversity Campus Diversity Hiring Practices 100% Satisfaction with Campus Racial/Ethnic Diversity (% Indicating Satisfied or Very Satisfied ) 80% 60% 40% 64.3% 53.5% 20% 100% 0% 90% Commitment to hiring women & minorities Your Institution 80% 70% All Institutions 60% 100% 50% 40% 80% 74.4% 30% 58.4% 54.0% 60% 48.7% 47.6% 20% 38.8% 40% 10% 59.2% 46.2% 0% 20% Racial and ethnic diversity of the faculty Racial and ethnic diversity of the staff Racial and ethnic diversity of the student body 0% Effective hiring practices & policies that increase staff diversity Your Institution All Institutions Your Institution All Institutions Return to Table of Contents 2019 Staff Climate Survey 20 Return to Table of Contents
Staff Perspectives on Campus Climate Staff Perspectives on Campus Climate (% Indicating Agree or Strongly Agree ) (% Indicating Agree or Strongly Agree ) This institution: 100% 90% 80% 70% 60% 50% 82.4% 81.9% 40% 75.9% 73.4% 68.3% 65.3% 64.2% 62.5% 30% 20% 30.7% 26.9% 10% 18.7% 4.2% 0% Encourages staff to have a public voice & share their ideas openly Has campus administrators who regularly speak about the value of diversity Promotes the appreciation of cultural differences Provides the campus community w/ opportunities to share feelings about issues of concern Rewards staff for their participation in diversity efforts Has a lot of racial tension Your Institution All Institutions Return to Table of Contents 2019 Staff Climate Survey 21 Return to Table of Contents
Campus Community & Diversity: Campus Community & Diversity: Institutional Priorities Institutional Priorities (% Indicating High or Highest Priority) (% Indicating High or Highest Priority) 100% 90% 80% 70% 60% 50% 83.5% 81.7% 40% 30% 56.2% 53.5% 50.9% 20% 39.5% 28.9% 25.4% 23.4% 10% 20.2% 0% Create and sustain partnerships with surrounding communities Enhance diversity on campus Investment in the professional development of staff Consider staff views in institutional decision- making Build or modernize campus facilities Your Institution All Institutions Return to Table of Contents 2019 Staff Climate Survey 22 Return to Table of Contents
Staff Discrimination or Exclusion Staff Discrimination or Exclusion % Indicating Experience with Discrimination or Exclusion at this Institution Because of Their: 100% 90% 80% 70% 60% 50% 42.4% 39.7% 40% 30% 24.1% 23.5% 20.8% 17.4% 17.2% 16.5% 20% 11.7% 8.9% 8.8% 10% 3.5% 0% Age Gender/ Gender Identity Job classification (e.g., title, position) Level of education Race/ethnicity Parent/guardian status Your Institution All Institutions Return to Table of Contents 2019 Staff Climate Survey 23 Return to Table of Contents
Discrimination and Harassment Discrimination and Harassment (% Indicating Ever Experienced at This Institution): (% Indicating Ever Experienced at This Institution): Please indicate how often at this institution you have: 100% 90% 80% 70% 60% 50% 40% 61.6% 30% 60.7% 48.0% 20% 35.4% 27.9% 24.7% 10% 20.0% 16.7% 13.9% 12.6% 0% Assisted a student with a problem about discrimination Witnessed discrimination Been sexually harassed Reported an incident Reported an incident of sexual harassment to a campus authority of discrimination to a campus authority Your Institution All Institutions Return to Table of Contents 2019 Staff Climate Survey 24 Return to Table of Contents
Staff Satisfaction with Staff Satisfaction with Administrative Administrative Responses (% Indicating Satisfied or Very Satisfied ) (% Indicating Satisfied or Very Satisfied ) Responses Satisfaction with timeliness of administrative responses to: 100% 90% 80% 70% 60% 50% 40% 74.4% 67.5% 30% 48.7% 46.8% 43.2% 20% 38.8% 10% 0% Campus emergencies Sexual assault Discrimination/bias Your Institution All Instituitons Return to Table of Contents 2019 Staff Climate Survey 25 Return to Table of Contents
Work Environment Return to Table of Contents Return to Table of Contents
Supervisors Supervisors (% Indicating Agree or Strongly Agree ) (% Indicating Agree or Strongly Agree ) My Supervisor: 100% 90% 80% 70% 60% 50% 88.7% 88.1% 87.2% 87.2% 84.6% 40% 79.1% 79.1% 78.4% 30% 20% 21.0% 10% 19.7% 20.0% 16.4% 0% Supports my professional development Sets unrealistic expecations for my job Demonstrates a commitment to diversity and inclusion Provides me with feedback that assists me in performing my job responsibilties Advocates for me Lacks the skills or knowledge to support me in my job Your Institution All Instituitons Return to Table of Contents 2019 Staff Climate Survey 27 Return to Table of Contents
Professional Development Professional Development (% Indicating Yes ) (% Indicating Yes ) Have you participated in any of the following opportunities provided by this institution: 100% 90% 80% 70% 60% 50% 40% 30% 60.2% 60.2% 50.7% 40.5% 20% 37.2% 33.9% 32.5% 28.1% 25.7% 25.4% 10% 0% Diversity-related trainings or workshops Optional technical skill development Leadership development Enhancement of interpersonal skills Job benefits training Your Institution All Institutions Return to Table of Contents 2019 Staff Climate Survey 28 Return to Table of Contents
Professional Development Professional Development (% Indicating Yes ) (% Indicating Yes ) Have you participated in any of the following opportunities provided by this institution: 100% 90% 80% 70% 60% 50% 40% 70.2% 67.5% 64.9% 30% 53.7% 51.0% 50.0% 47.7% 41.8% 20% 10% 17.4% 12.6% 0% Public safety/security training Health and wellness programs Mentorship Networking events Policy and procedure training Your Institution All Institutions Return to Table of Contents 2019 Staff Climate Survey 29 Return to Table of Contents
The more you get to know your campus community, the better you can understand their needs. For more information about HERI/CIRP Surveys The Freshman Survey Your First College Year Survey Diverse Learning Environments Survey College Senior Survey The Faculty Survey Staff Climate Survey Please contact: heri@ucla.edu (310) 825-1925 www.heri.ucla.edu Return to Table of Contents 2019 Staff Climate Survey 30 Return to Table of Contents