Predicting NBA Success Using Collegiate Statistics
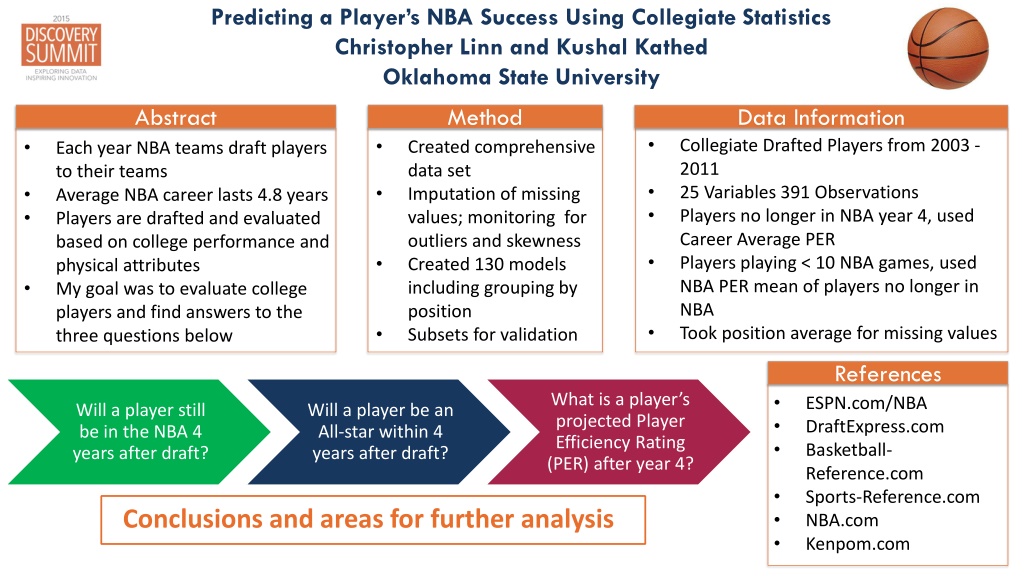
Researchers from Oklahoma State University analyzed collegiate statistics of NBA players drafted from 2003 to 2011 to predict their success in the league. They investigated factors such as player longevity, All-Star potential, and projected Player Efficiency Rating (PER) after four years. The study involved creating comprehensive datasets, developing 130 models, and considering various variables to make informed predictions. The findings offer insights into player performance and highlight key aspects for evaluating college players for NBA success.

Download Presentation

Please find below an Image/Link to download the presentation.
The content on the website is provided AS IS for your information and personal use only. It may not be sold, licensed, or shared on other websites without obtaining consent from the author. Download presentation by click this link. If you encounter any issues during the download, it is possible that the publisher has removed the file from their server.
E N D
Presentation Transcript
Predicting a Players NBA Success Using Collegiate Statistics Christopher Linn and Kushal Kathed Oklahoma State University Abstract Method Data Information Collegiate Drafted Players from 2003 - 2011 25 Variables 391 Observations Players no longer in NBA year 4, used Career Average PER Players playing < 10 NBA games, used NBA PER mean of players no longer in NBA Took position average for missing values Created comprehensive data set Imputation of missing values; monitoring for outliers and skewness Created 130 models including grouping by position Subsets for validation Each year NBA teams draft players to their teams Average NBA career lasts 4.8 years Players are drafted and evaluated based on college performance and physical attributes My goal was to evaluate college players and find answers to the three questions below References Will a player still be in the NBA 4 years after draft? Will a player be an All-star within 4 years after draft? What is a player s projected Player Efficiency Rating (PER) after year 4? What is a player s projected Player Efficiency Rating (PER) after year 4? ESPN.com/NBA DraftExpress.com Basketball- Reference.com Sports-Reference.com NBA.com Kenpom.com Will a player still be in the NBA 4 years after draft? Will a player be an All-star within 4 years after draft? Conclusions and areas for further analysis Conclusions and areas for further analysis
Will a Player be in the NBA 4 Years after NBA Draft? % of Players Still in the NBA by end of 4th Year 80% 70% PER Players still in NBA 14.74 60% 50% PER Players no longer in NBA 9.66 40% 30% 20% 10% Continue to Modeling 0% Continue to Modeling Point Guard Shooting Guard Small Forward Power Forward Center
Will a Player Still be in the NBA 4 Years after NBA Draft? Age Win Shares Strength of Schedule Point Guard Ordinal Logistic Model P-value Threshold .05 Mixed Stepwise Age Height Win Shares Steals per 40 Minutes Shooting Guard Misclassification Rate = 26% Small Forward Height PER Position Grouped Ordinal Logistic Models P- value Threshold .05 Mixed/Forward Stepwise Misclassification Rate = 23% Power Forward Age Win Shares Adj PER Position Grouped Subsets for Validation Age Body Fat% Defensive Win Shares Subset 1: Misclassification Rate = 22.1% Center Subset 2: Misclassification Rate = 24.1%
Will a Player be an All-Star within 4 Years after NBA Draft? Ordinal Logistic Model (Stepwise P-value Threshold .05 Mixed) Misclassification Rate = 5% 13.6% Sensitivity (% of players that become Allstar predicted correctly) 99.7% Specificity (% of players that are non Allstar predicted correctly) Validation Subsets Subset 1: Misclassification Rate = 5.6% Subset 2: Misclassification Rate = 4.1% % of Players that become All-Stars within 4 Years 10% 9% 8% 7% 6% 5% 4% 3% 2% 1% 0% Point Guard Shooting Guard Small Forward Power Forward Center All-star PER 22.09 Non All-Star PER 12.26
What is a Players Projected Efficiency Rating after Year 4? Age Height Win Shares True Shooting % Rebounds per 40 Min Point Guard Standard Least Squares Model P-value Threshold .05 Mixed Stepwise Rsquare Adjusted = 28% Shooting Guard Age Points per 40 Min Blocks per 40 Min Small Forward Position Grouped Standard Least Square Model P-value Threshold .05 Mixed Stepwise Age Rsquare Adjusted = 32% Power Forward Age Win Shares Adj PER Position Grouped Subsets for Validation Age Wingspan Rebounds per 40 Min Assists per 40 Min Subset 1: Rsquare Adjusted = 30.6% Center Subset 2: Rsquare Adjusted = 30.1%
Conclusions and Areas for Further Analysis Other Applications for Grouping Variables Conclusions Further Analysis Models should be used to assist teams when selecting players to draft Best models were created when grouping players by position These models can t predict injuries, personality issues, and players not getting adequate opportunity Players drafted at a younger age typically have better success Add variables (College Coach, Max Vertical, Bench Press, Lane Agility, etc) Use scout and insider analysis to apply text mining/ sentiment analysis for predictive modeling Explore segmentation due to teams needing certain types of skill sets that fit their system Determining whether a customer will purchase based on demographics when grouped by geographic areas Determine the number of emergency room visits per patient during flu season grouped by gender