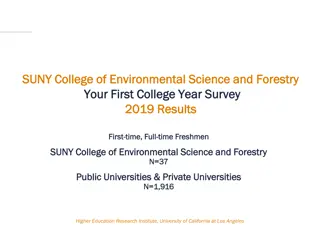
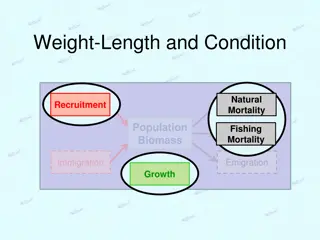
Analyzing Critical Metrics and Activities in Academic Affairs 2022-23 at SUNY Oswego
Fall enrollment trends, growth in graduate programs, impact on new undergraduates, online program expansion, and retention rates of new students contribute to a comprehensive overview of academic performance and planning at SUNY Oswego for the 2022-23 academic year.

Download Presentation

Please find below an Image/Link to download the presentation.
The content on the website is provided AS IS for your information and personal use only. It may not be sold, licensed, or shared on other websites without obtaining consent from the author. Download presentation by click this link. If you encounter any issues during the download, it is possible that the publisher has removed the file from their server.
E N D
Presentation Transcript
ACADEMIC AFFAIRS 2022-23 CRITICAL METRICS AND ACTIVITIES Scott R. Furlong, Provost/VPAA/VPEM SUNY Oswego
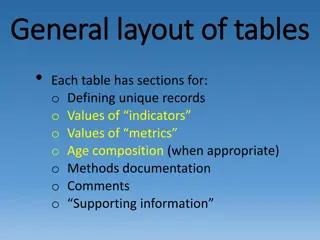
AGENDA Enrollment Updates, Planning Student Success Equity Intensive (SSEI) Data Projects First Year Seminars Other items
Fall Degree-seeking Students 9000 6,800 is truly extraordinarily low. 8000 Let s dig a bit deeper to understand where we were, where we are, and where we might be going. 7000 6839 6000 5000 What does a 1,000-student decline mean? 4000 3000 2000 1000 0 2012 2013 2014 2015 2016 2017 2018 2019 2020 2021 2022
Fall Degree-seeking Students Graduate Undergraduate 8000 7000 6000 Graduate enrollment has been growing very steadily. The R2 for the yellow line is 0.96. But the slope is not steep... we are gaining about 30 graduate students a year. 5000 4000 30 students a year obviously can't fill a 1000 student hole any time soon. 3000 2000 1000 0 2012 2013 2014 2015 2016 2017 2018 2019 2020 2021 2022
New Undergraduates, Fall and prior Spring (high and low values noted) Transfers Freshmen 2000 1800 1649 1600 1546 1400 1234 1200 1114 1000 800 756 The downward slope of the new transfer line is 30 students a year; in one sense, the growth in graduate programs has compensated for reduced transfers but not declines and variance in the freshman numbers. 600 400 200 0 2012 2013 2014 2015 2016 2017 2018 2019 2020 2021 2022
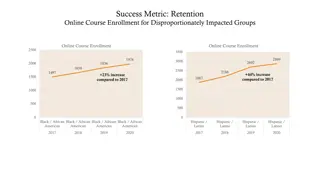
ONLINE PROGRAM GROWTH By Level: Online Program Majors, Fall 900 Undergraduate Graduate 800 766 700 500 600 400 500 400 300 300 200 200 100 100 0 0 2018 2019 2020 2021 2022 2018 2019 2020 2021 2022 Truly moving into new service markets -- older and more part-time: 45% of undergraduates aged 26 or older are in on-line programs, compared to only 3% of younger undergraduates. Similarly, 26% of undergraduates attending part-time are in on-line programs, compared to only 4% of full-time undergraduates.
RETENTION CONTRIBUTES Retention of New Full-time Fall FRESHMEN into Second Year 90% 80% 73% 70% 60% 50% 2010 2012 2014 2016 2018 2020 2022 Retention of New Full-time Fall TRANSFERS into Second Year 90% 82% 80% 70% 60% 50% 2010 2012 2014 2016 2018 2020 2022
RETENTION, CONTINUED Statistical predictions of retention show that the primary factor is students grades, followed by some demographic variables (gender, minority background). Once those things are held in check, field of study does not predict retention. Areas with low retention rates have low rates because their students have low grades statistically speaking. Retained in Same Department or School Cohorts 2020 and 2021 Retained in Same Major Switched Fields Not Retained Retained Technology Dept 72 74% 3% 4% 19% 81% Communication Studies 175 67% 5% 7% 21% 79% Cinema & Screen Studies 52 58% 0% 21% 21% 79% School of Business 425 61% 8% 7% 24% 76% Art Dept 92 52% 23% 1% 24% 76% All with under 50 in cohorts 449 62% 2% 11% 25% 75% Education Programs 263 54% 11% 10% 25% 75% Psychology 204 58% 2% 12% 28% 72% Computer Science Dept 109 44% 7% 18% 30% 70% Biology Dept 261 47% 2% 18% 33% 67% Undeclared 224 16% 0% 51% 33% 67% Criminal Justice Total 2020 and 2021 107 2433 52% 54% 0% 5% 9% 14% 38% 27% 62% 73%
Projecting Fall Continuing Enrollments Regression Statistics Multiple R R Square Spring Freshmen Spring Juniors Continuing Fall Undergraduates Spring Sophomores Spring Seniors Projection 0.99 0.98 Standard Error 346.36 Coefficients -886.78 t Stat -2.56 2.10 4.84 5.97 6.05 P-value 0.04 0.08 0.00 0.00 0.00 7000 Intercept Freshmen Sophomores Juniors Seniors 0.56 1.02 1.07 0.77 0.27 0.21 0.18 0.13 3954 3723 6000 5000 4000 Degree-seeking Students projected for Fall 2023 3000 Continuing Undergraduates, projected with model New Freshmen, last fall's total (full- and part-time) New Transfers, last fall's total (full- and part-time) Graduate Students: last fall + 30 3723 1468 535 912 6638 2000 1000 Fall 2022 Degree-seeking Total Change from 2022 to projected 2023 6839 -201 0 2012 2013 2014 2015 2016 2017 2018 2019 2020 2021 2022 2023
FIVE YEAR PLAN OUTLINE 2022 2023 2024 2025 2026 2027 Traditional Baccalaureate New Fall Freshmen 1468 1339 1500 1345 1500 1314 115 1500 1277 138 1500 1250 150 100 1500 1250 150 100 New York US International 3 reduction in NY freshmen balanced against 1 & 2 to yield 1500 1 growing US freshmen by 20% per year up to 150 2 growing intrnational freshmen by 20% per year up to 100 80 49 96 59 71 85 New Fall Transfers 391 320 23 48 371 288 25 58 354 259 25 70 350 250 25 75 350 250 25 75 350 250 25 75 New York US International 3 reduce traditional transfers from NY by 10% per year down to 250 2 grow US transfer by 10% per year up to 25 1 grow intl transfer by 20% per year up to 75 Continuing Students 3720 3520 3500 3650 3900 4150 Growth reflects getting back to 1500 but will take time Online and Syracuse Undergraduates 406 447 491 540 594 650 1 grow 10% per year up to 650 Graduate Students, all types 921 1013 1114 1226 1300 1300 1 grow 10% per year up to 1300 Exchange 45 50 50 50 50 50 Total (with Exchange) 6951 6901 7010 7316 7694 8000
NEW FALL 2023 UNDERGRADUATE UPDATE Will we reach last year s totals? Can we grow even more? Or will the 2023 classes be smaller? Freshmen Transfers 4/16/23 4/16/22 4/16/23 4/16/22 Applications 1301 1037 Applications 14630 12122 Deposits 195 152 Deposits 654 732
STUDENT SUCCESS EQUITY INTENSIVE S S E I Belongingness: gaps based on race/ethnicity, first-generation status, sex/gender orientation, and income (Pell) status Financial stability: gaps based on income status Credit Completion: gaps between racial/ethnic groups
BELONGINGNESS Some data The plans: "Agree Strongly" GST 104 I regularly discuss my academic and career plans one-on-one with a prof. advisor or faculty FYS on voluntary basis Gender inclusivity data collection, assessment and program development I believe I have enough academic support to get me through college Communication plans for First Generation Students; First Lakers identify development Work to increase funding for multicultural student organizations through Student Association I feel like I can relate to other people in my major Multicultural and other Living-Learning Community pilots I feel comfortable participating in class Inclusive Teaching faculty and staff development Peer mentoring 0% 20% 40% 60%
FINANCIAL STRESS/STABILITY Some data (National College Health Assessment) The plan: Student financial aid mentors Students who have faced challenges, trauma or difficulties in the past 12 months due to: Financial Literacy modules to push into classes and into student orgs Office hours for peer-to-peer Academics Finances 58% 60% Included in Title III grant request 46% 50% Financial Literacy work will also be embedded into a full-time position, taking advantage of a pending retirement 40% 30% 30% 20% Institutional Scholarship review committee 10% 0% 2014 2018 2021
CREDIT COMPLETION Some data The plan: Percent of Lower Level Credits not Earned: Fall 2022 Embedded tutoring Withdrew Failed May focus on lower-level math courses, due to their difficulty and importance across the curriculum 30% 25% 20% 20% Faculty development funding is included in Title III grant request 15% 15% 12% 12% 10% 7% 8% First-year Seminars on voluntary basis 5% 9% 9% 8% 7% 6% 3% 0%
CREDIT COMPLETION, BELONGINGNESS, AND DEGREE ATTAINMENT IS THE DOMAIN OF THE FACULTY Potential for First year Impact Universally Available or Required High Impact Practice Areas Comments Capstone Courses and Projects Collaborative Assignments and Projects Possible No Yes Structure varies by major Any use of this HIP is on a teacher-by-teacher basis right now GST 104 will be common, but does not focus on intellectual development Yes, Gen Ed Not a freshman focus currently No Not a freshman focus Not used here No Voluntary basis No Access and use varies by major No Not used here currently; Student Affairs is studying No Limited use through some GST courses; voluntary basis No Access and use varies by major Yes Heavy reliance on adjunct and visiting faculty for ENG 102 No Common Intellectual Experiences Diversity Learning Global Learning ePortfolios First-year Seminars Internships Learning Communities Service Learning Undergraduate Research Writing-Intensive Courses Possible Possible Some No Yes No Possible Possible No Yes Yes
ACTIVITIES & EVENTS Great Lakes Institute Rich and Pour Caf SUNY CIT Conference (May 23 26) Romeo and Juliet; BFA Shows; State Singers/College Choir QUEST April 19th and April 18th at 5:30 at Syracuse campus Serving our access mission with online programs (IPS, Business, others) and minors; microcredentials; work on PLA Library Research Party (April 25)