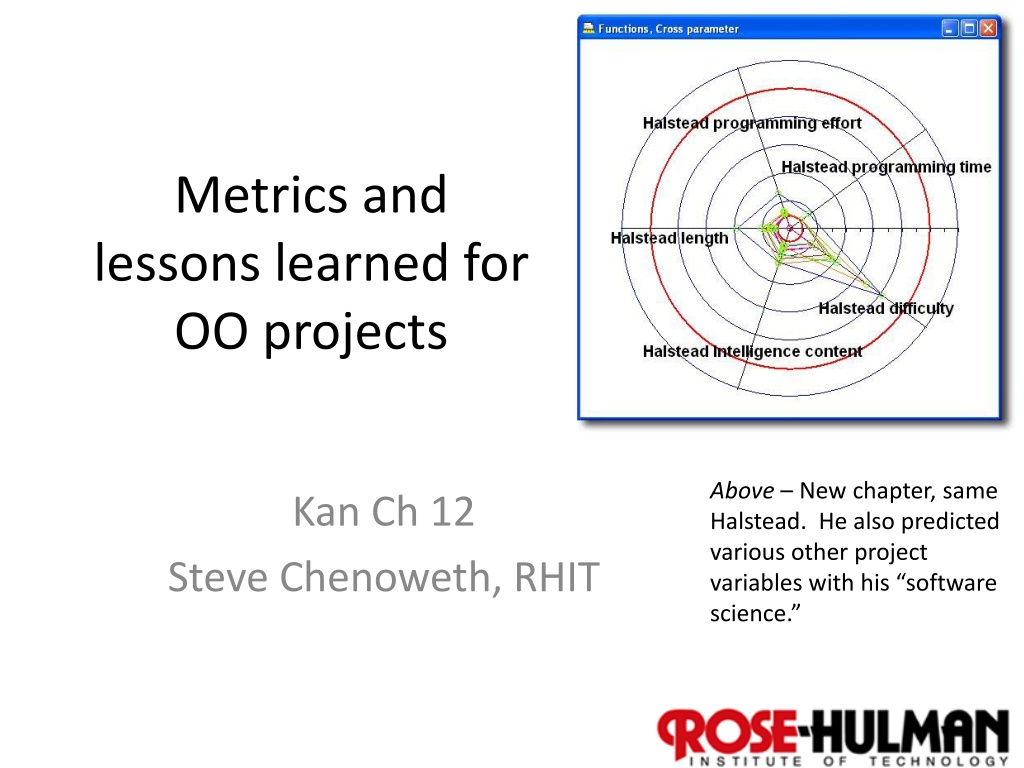
Metrics and Lessons Learned for Object-Oriented Projects
This chapter discusses various metrics and lessons learned for object-oriented projects, including the use of major OO metrics, Lorenz's metrics, IBM's Object Oriented Technology Council recommendations, and the CK metrics suite. The CK metrics suite covers six OO design and complexity measures, such as Weighted Metrics per Class, Depth of Inheritance Tree, Number of Children of a Class, Coupling Between Object Classes, Response For a Class, and Lack of Cohesion on Methods. The authors applied these metrics to C++ and Smalltalk projects, highlighting differences in design decisions and language-specific characteristics.

Download Presentation

Please find below an Image/Link to download the presentation.
The content on the website is provided AS IS for your information and personal use only. It may not be sold, licensed, or shared on other websites without obtaining consent from the author. Download presentation by click this link. If you encounter any issues during the download, it is possible that the publisher has removed the file from their server.
E N D
Presentation Transcript
Metrics and lessons learned for OO projects Above New chapter, same Halstead. He also predicted various other project variables with his software science. Kan Ch 12 Steve Chenoweth, RHIT 1
Major OO metrics Use OO concepts and constructs, like Abstract class, Instance, and Inheritance. Classes and methods are the basic constructs. Amount of function can be estimated based on the number of identified classes and methods. Also use size or function points of these. 2
Lorenzs metrics 3
IBMs OOTC Kan looked at what IBM s Object Oriented Technology Council recommended to IBM s product divisions. Compared six projects. Ranged from large to small. One had much larger number of methods per class, a large class, and a larger maximum depth of inheritance tree than guidelines suggested. This one also had a high defect volume and rate. 4
The CK metrics suite Chidamber and Kemerer, 1994 Six OO design and complexity measures. 1. Weighted metrics per class (WMC). Sum of cyclomatic complexities of the methods. Hard to measure, because of inheritance. Often just the average number of methods per class. 2. Depth of inheritance tree (DIT). Length of maximum patho of a class hierarchy from the node to the root of the inheritance tree. 5
The CK metrics suite, cntd 3. Number of children of a class (NOC). Number of immediate successors (subclasses) of a class. 4. Coupling between object classes (CBO). Number of classes a given class is coupled to. 5. Response for a class (RFC). Number of methods that can be executed in response to a message. 6. Lack of cohesion on methods (LCOM). How closely local methods are related to local instance variables in a class. 6
The CK metrics suite, cntd Chidamber and Kemerer applied these six metrics to a C++ project and to a Smalltalk project. Low DITs and NOCs authors thought the designers might not be taking advantage of reuse through inheritance. Had striking differences in CBOs and RFSs. Median values for Smalltalk site much higher. Reflected language differences. 7
The CK metrics suite, cntd Basili, et al (1996) studied students doing C++ programming. Found that: The six CK metrics were relatively independent. Low values of DITs and NOCs. LCOM did not predict faulty classes. DIT s, RFC s, NOC s and CBO s did correlate with faulty classes. These OO metrics were more predictive than code metrics. 8
The CK metrics suite, cntd 1997 study by Chidamber, Darcy and Kemerer: Three systems for financial trading. Small values for depth of inheritance (DIT). Found that WMC, RFC, and CBO were highly correlated. Kan thinks many more empirical studies are needed. In this study, they also estimated the CK metrics suite s effects on productivity. Found that high levels of CBOs and LCOMs were associated with lower productivity. 9
Productivity metrics Kan generally stays away from these. He recommends Capers Jones s work. Studies generally measure number of units of output per unit of effort. In OO development, classes or methods per PY or PM. Kan did calculations for some IBM projects. A high number of classes per PM related to a small number of methods per class. IBM s heuristic 1 to 3 PM per (key) business class. 10
Kans dimensions of productivity Everyone has a different version of this! Kan points out that it s not just 2-dimensional output vs effort. 11
Quality and quality management metrics In OO, it s defects per class. Data not as common as for non-OO projects. Kan found defect rates from 0.21 defects per class to 0.69 per class. Equivalent to 2.6 defects per KLOC (new and changed code) to 8.2 defects per KLOC. Kan s non-OO experience has been: 4 to 9 defects per KLOC. 12
For quality management The OO design and complexity metrics can be used to flag the classes with potential problems for special attention. Kan thinks metrics for non-OO projects also pertain to OO. Test progress S curve Testing defect arrivals over time Testing defect backlog over time Number of critical problems over time Number of system crashes and hangs over time The effort/outcome paradigm for interpreting in-process metrics 13
OO Lessons learned Kan conducted assessments of IBM OO projects. Need to allow a learning curve, when moving to OO. Formal classroom education is needed (sounds like software engineering!). Domain-specific knowledge also is needed. 14
Kans OO tips A consistent process architecture in an organization. Monthly goals or mini-milestones set. Good reusable classes hard to build. OO technology does not = code reuse. An inherent conflict between development cycle time and building reusable classes. Performance projects fail because of it. More on that next week. Quality and development practices OO makes bugs easier to find and fix. OO projects have lower defect rates during testing phases and in the field. 16
Recommendations for small orgs Design and complexity metrics work well. Need a chief architect for overall system design. Small teams own small subsystems. Use OO counting tools. Many things can be tracked without tools: Methods per class Depth of inheritance tree Number of children Number of classes Methods thrown away (!) Procedural tools also apply. 17