Hospital Quality Performance Metrics Overview
This collection of performance metrics in a hospital setting includes measures related to patient safety, care processes, outcomes, and overall quality. Metrics range from completion of Pediatric Early Warning System (PEWS) charts to cardiac arrests, length of stay, medication prescribing errors, mortality rates, and more. Each metric provides insights into different aspects of hospital performance, aiming to improve patient care and safety.

Download Presentation

Please find below an Image/Link to download the presentation.
The content on the website is provided AS IS for your information and personal use only. It may not be sold, licensed, or shared on other websites without obtaining consent from the author. Download presentation by click this link. If you encounter any issues during the download, it is possible that the publisher has removed the file from their server.
E N D
Presentation Transcript
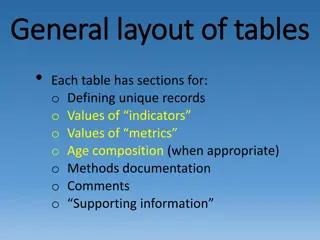
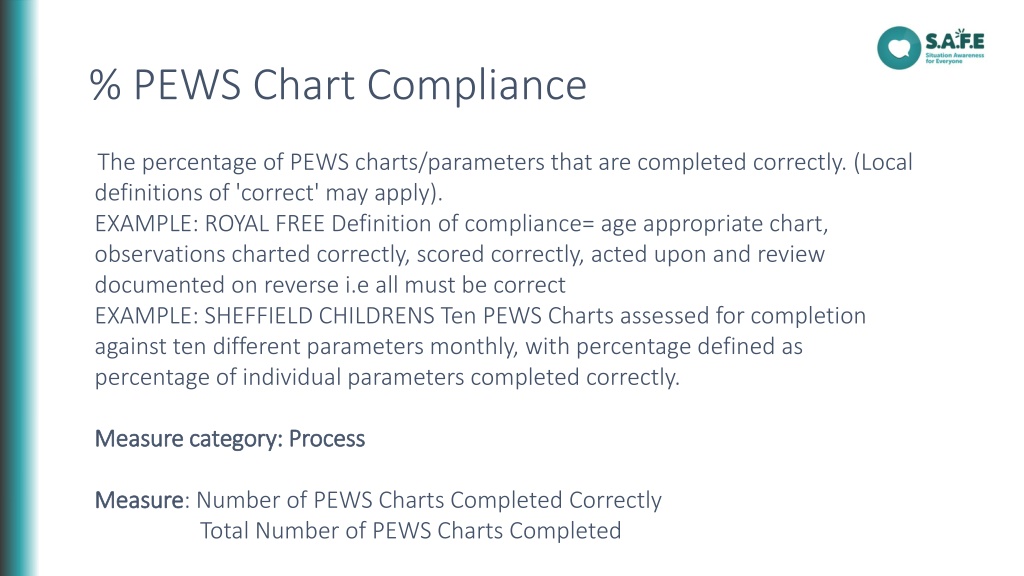
% PEWS Chart Compliance The percentage of PEWS charts/parameters that are completed correctly. (Local definitions of 'correct' may apply). EXAMPLE: ROYAL FREE Definition of compliance= age appropriate chart, observations charted correctly, scored correctly, acted upon and review documented on reverse i.e all must be correct EXAMPLE: SHEFFIELD CHILDRENS Ten PEWS Charts assessed for completion against ten different parameters monthly, with percentage defined as percentage of individual parameters completed correctly. Measure category: Process Measure category: Process Measure Measure: Number of PEWS Charts Completed Correctly Total Number of PEWS Charts Completed
% SBAR Use at Handover The percentage of patients handed over in an SBAR format at any handover. The percentage of patients handed over in an SBAR format at any handover. Measure category: Process Measure category: Process Measure Measure: Number of Individual Patient Handovers Using SBAR Total Number of Individual Patient Handovers
% UNSAFE PICU Transfers The percentage of PICU Transfers that were UNSAFE in each month. UNSAFE transfers are defined as: - Required intubated and ventilated - Started on ionotropes - Needed a large amount of fluid resuscitation Within the first hour of transfer to PICU. Measure category: Outcome Measure category: Outcome Measure Measure: Number of UNSAFE PICU Transfers Total PICU Transfers
Cardiac Arrests Any cardiac arrests occurring on ward defined as staff having to use chest compression or a defibrillator on a patient. Measure category: Outcome Measure Measure: Number of cardiac arrests
Length of Stay (aggregate) Average overall length of stay for inpatient admissions. Measure category: Outcome Measure: Measure: Average length of stay
Medication Prescribing Error This is a measure of the number of percentage of charts that are error free Measure category: Process Measure category: Process Measure Measure: Prescribing incorrect Prescriptions
Mortality Any deaths on the ward. Measure category: Outcome Measure Measure: Number of deaths
Respiratory Arrests Any respiratory arrests occurring on ward defined as staff having to use a positive pressure ventilator on a patient. Measure category: Outcome Measure Measure: Number of respiratory arrests
Unplanned transfers to a higher level of care Any change in allocation (upwards)/escalation of care and includes: transfers to High Dependency Unit, any increase in level of observation and any increase in staffing ratios for that patient. Measure category: Outcome Measure Measure: Number of unplanned transfers


")