Education Success Metrics Overview

 undefined
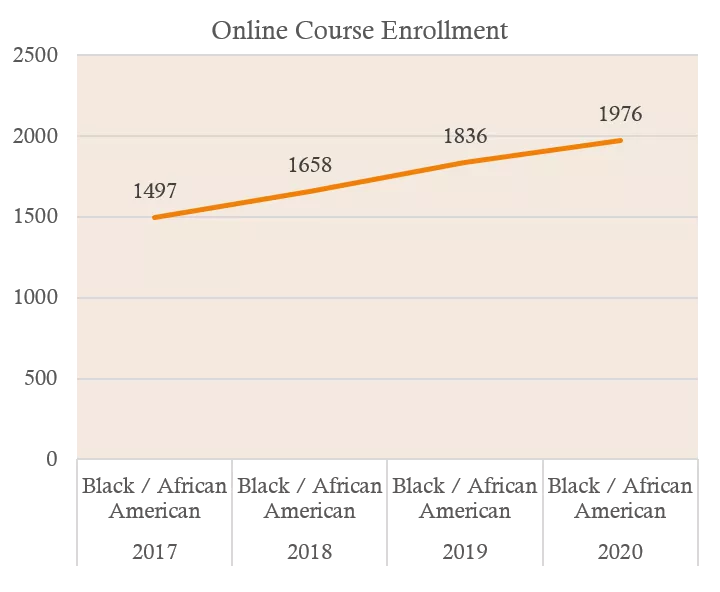
+23% increase
compared to 2017
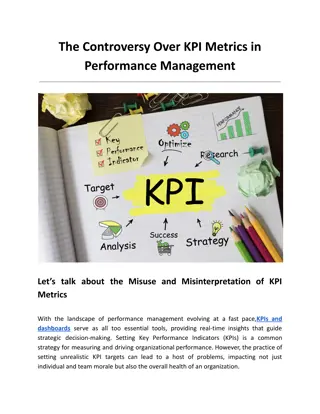
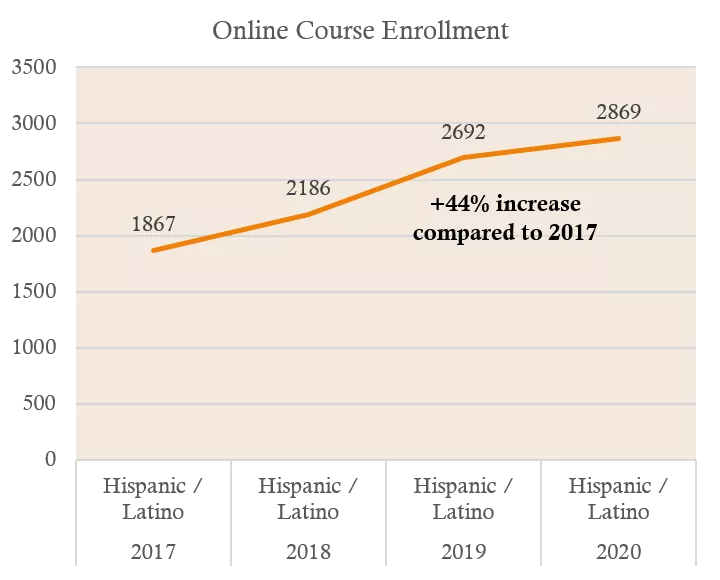
Success Metric: Retention
Online Course Enrollment for Disproportionately Impacted Groups
 undefined
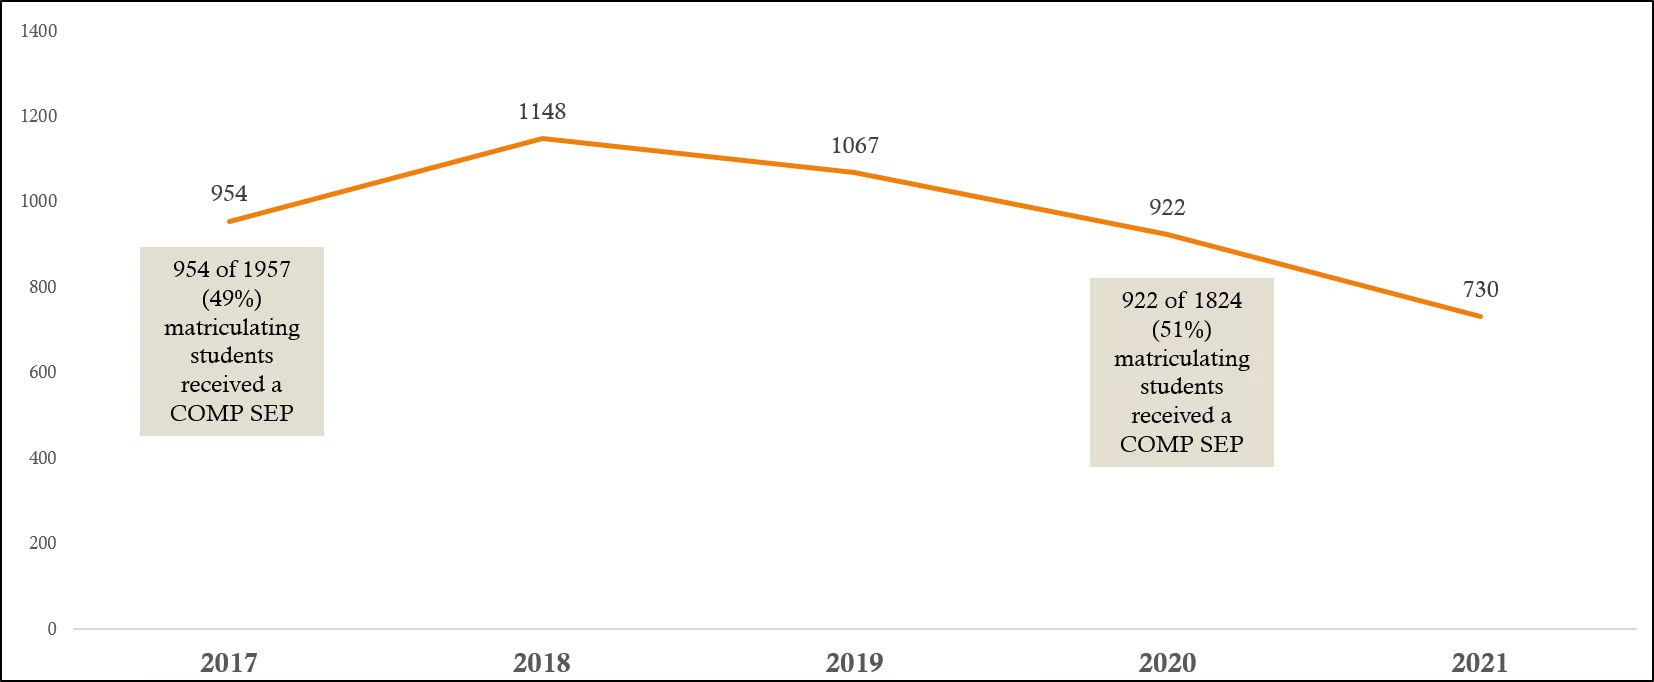
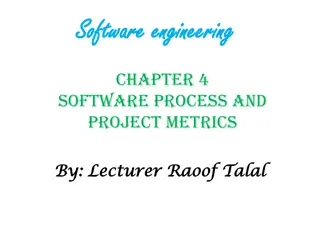
Success Metric: Transfer to a Four -Year Institution
No. of Comprehensive SEPs for Matriculating Students

1148 of 2088
(55%)
matriculating
students
received a
COMP SEP
257 of 927
students Completed
both transfer level
English & Math
within their 1
st
year
(28%)
223 of 936
students Completed
both transfer level
English & Math
within their 1
st
year
(24%)
124 of 1003
students Completed
both transfer level
English & Math
within their 1
st
year
(12%)
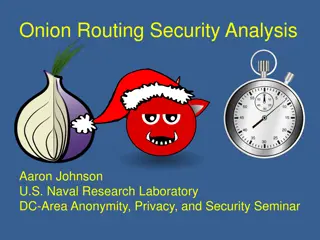
Success Metric:
Complete Both Transfer-level Math and English in the first academic year
Source: CCC Student Success Metrics Dashboard https://www.calpassplus.org/LaunchBoard/Student-Success-Metrics.aspx
121 of 858
students Completed
both transfer level
English & Math
within their 1
st
year
(14%)
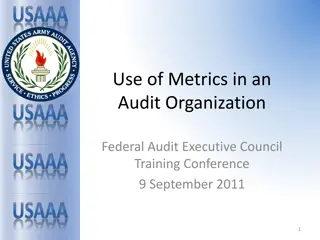
Success Metric: Attained Vision 2022 Completion Goal
Degrees & Certificates Conferred By Year
690
746
821
797
732
Did we increase the number of disproportionately impacted students who successfully completed an online course and enroll in the following term by 20% by June 2020? Yes. For the African American and Latinx student population ( both groups that have reflected disproportionate numbers in 2017) the number online course enrollments rose by 23% and 44% respectively in 2019.
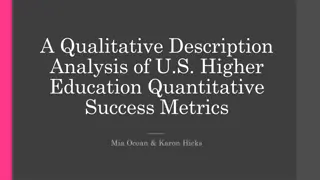
This analysis showcases various success metrics in education, including retention rates for online course enrollment for disproportionately impacted groups, transfer to four-year institutions, completion of both transfer-level math and English, and attainment of the Vision 2022 completion goal in degrees and certificates conferred by year. The data reveals increases in online course enrollment, percentages of students receiving Comprehensive SEPs, and completion rates in transfer-level coursework. Additionally, it tracks the attainment of degree and certificate completion goals from 2016 to 2021. The information is derived from the CCC Student Success Metrics Dashboard.

Download Presentation

Please find below an Image/Link to download the presentation.
The content on the website is provided AS IS for your information and personal use only. It may not be sold, licensed, or shared on other websites without obtaining consent from the author. Download presentation by click this link. If you encounter any issues during the download, it is possible that the publisher has removed the file from their server.
E N D
Presentation Transcript
Success Metric: Retention Online Course Enrollment for Disproportionately Impacted Groups Online Course Enrollment Online Course Enrollment 2500 3500 2869 1976 3000 2692 2000 1836 1658 2500 2186 1497 +44% increase compared to 2017 +23% increase compared to 2017 1500 1867 2000 1500 1000 1000 500 500 0 0 Black / African American Black / African American Black / African American Black / African American Hispanic / Latino Hispanic / Latino Hispanic / Latino Hispanic / Latino 2017 2018 2019 2020 2017 2018 2019 2020
Success Metric: Transfer to a Four -Year Institution No. of Comprehensive SEPs for Matriculating Students 1400 1148 1200 1067 954 1000 922 1148 of 2088 (55%) matriculating students received a COMP SEP 954 of 1957 (49%) matriculating students received a COMP SEP 730 800 922 of 1824 (51%) matriculating students received a COMP SEP 600 400 200 0 2017 2018 2019 2020 2021
Success Metric: Complete Both Transfer-level Math and English in the first academic year 257 of 927 students Completed both transfer level English & Math within their 1st year (28%) 223 of 936 students Completed both transfer level English & Math within their 1st year (24%) 124 of 1003 students Completed both transfer level English & Math within their 1st year (12%) 121 of 858 students Completed both transfer level English & Math within their 1st year (14%) Source: CCC Student Success Metrics Dashboard https://www.calpassplus.org/LaunchBoard/Student-Success-Metrics.aspx
Success Metric: Attained Vision 2022 Completion Goal Degrees & Certificates Conferred By Year 100% 90% 821 797 746 732 80% 690 70% 60% 50% 40% 30% 20% 10% 0% Annual 2016-2017 61 34 202 44 Annual 2017-2018 70 73 221 41 Annual 2018-2019 87 52 207 35 Annual 2019-2020 61 60 223 44 9 Annual 2020-2021 81 61 216 42 4 Associate in Arts for Transfer (A.A.-T) Degree Associate in Science for Transfer (A.S.-T) Degree Associate of Arts (A.A.) degree Associate of Science (A.S.) degree Certificate requiring 16 to fewer than 30 semester units Certificate requiring 18 to < 30 semester units Certificate requiring 30 to < 60 semester units Certificate requiring 6 to < 18 semester units Noncredit award requiring from 288 to < 480 hours 26 356 9 15 360 17 8 399 33 320 23 6 281 5