Data Analysis Techniques in Geophysics Using MATLAB

Explore data processing, analysis, and visualization techniques in geophysics through MATLAB. Learn how to generate synthetic data, calculate mean and standard deviation, select data within a certain range, and plot the results effectively. Embrace the power of MATLAB for geophysical data exploration.

Download Presentation

Please find below an Image/Link to download the presentation.
The content on the website is provided AS IS for your information and personal use only. It may not be sold, licensed, or shared on other websites without obtaining consent from the author. Download presentation by click this link. If you encounter any issues during the download, it is possible that the publisher has removed the file from their server.
E N D
Presentation Transcript
C E R I C E R I- -7 1 04/ C IV L 7 1 04/ C IV L - -8 1 2 6 D ata A nalysis in 8 1 2 6 D ata A nalysis in G eophysics G eophysics i) Intro to M atlab C ontinued
S ample data processing and selection exercise. M ake a sample random noise data set. F ind the mean, standard deviation and select the data between mean standard deviation (no loops or explicit if statements)
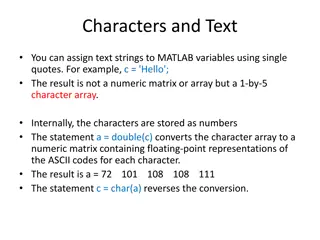
M ake synthetic data M ake synthetic data a=rand(100,1); P lot histogram to see distribution P lot histogram to see distribution hist(a)
N ow calculate the mean and standard deviation m=mean(a) s=std(a) P lot data, line for mean, lines for mean standard dev plot(a,'.') hold on plot([0 100],[m m],'r') plot([0 100],[m+s m+s],'g') plot([0 100],[m-s m-s],'g') indx=find(m-s<a&a<m+s); plot(indx,a(indx),'*')
N ow find all the points whose value is within one standard deviation of the mean using the matlab find function. T his returns the index numbers of the points selected. indx=find(m-s<a&a<m+s); Now plot the selected points using the index as the x value (data is plotted against index) and the selected points. plot(indx,a(indx),'*')
D ata - blue dots. M ean red line M ean standard devaition green lines S elected data - red asterisks.
R edo with normal distribution around zero. N O L O O P S N O E X P L IC IT IF s F ully M atlab vectorized.