Introduction to MATLAB: A Powerful Tool for Mathematical Problem Solving

MATLAB, short for MATrix LABoratory, is a programming language designed to tackle mathematical, scientific, and engineering problems. It is well-suited for working with matrices, vectors, and sequences of numbers, in addition to offering various functions for scalar operations like calculating length, average, median, and mode. Understanding the basics of MATLAB can significantly enhance problem-solving capabilities in various technical fields.

Uploaded on Oct 04, 2024 | 0 Views
Download Presentation

Please find below an Image/Link to download the presentation.
The content on the website is provided AS IS for your information and personal use only. It may not be sold, licensed, or shared on other websites without obtaining consent from the author. Download presentation by click this link. If you encounter any issues during the download, it is possible that the publisher has removed the file from their server.
E N D
Presentation Transcript
MATLAB (MATrix LABoratory) Un lenguaje de programaci n orientado a resolver problemas matem ticos, cient ficos y de ingenier a
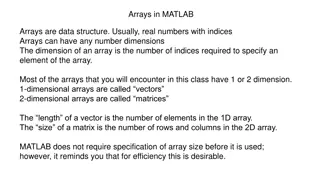
Matrices y Vectores Matriz tabla de n meros (valores) organizada en filas y columnas ejemplo: [ 1, 2, 3 ; 4, 5, 6] 2 filas de 3 columnas c/u separadores: , o espacio para columnas y ; para filas Vector fila o columna de n meros ejemplo de fila: [1, 2, 3 ,4, 5, 6] ejemplo de columna: [1; 2; 3; 4; 5; 6]
Vector con secuencia de nmeros >> numeros=1:12 numeros = 1 2 3 4 5 6 7 8 9 10 11 12 >> impares=1:2:12 impares = 1 3 5 7 9 11 >> pares=2:2:12 pares = 2 4 6 8 10 12 >>
>>help plot PLOT Linear plot. PLOT(X,Y) plots vector Y versus vector X. If X or Y is a matrix, then the vector is plotted versus the rows or columns of the matrix, whichever line up. If X is a scalar and Y is a vector, disconnected line objects are created and plotted as discrete points vertically at X. PLOT(Y) plots the columns of Y versus their index. If Y is complex, PLOT(Y) is equivalent to PLOT(real(Y),imag(Y)). In all other uses of PLOT, the imaginary part is ignored. Various line types, plot symbols and colors may be obtained with PLOT(X,Y,S) where S is a character string made from one element from any or all the following 3 columns: b blue g green r red c cyan m magenta y yellow k black w white . point - o circle : dotted x x-mark -. dashdot + plus -- * star (none) no line s square d diamond v triangle (down) ^ triangle (up) < triangle (left) > triangle (right) p pentagram h hexagram solid dashed For example, PLOT(X,Y,'c+:') plots a cyan dotted line with a plus at each data point; PLOT(X,Y,'bd') plots blue diamond at each data point but does not draw any line.
Funciones que devuelven un escalar (n) >>n=length(h) n = 12 >>suma=sum(h) suma = 20.3400 >>promedio=mean(h) %sum(h)/length(h) promedio = 1.6950 >> hmin=min(h) >> hmax=max(h) hmin = hmax= 1.5200 1.8700 >> mediana=median(h) %valor central (la mitad son >s y la otra <s) mediana = 1.6900 >> moda=mode(h) %valor que m s se repite moda = 1.6500
Funciones que devuelven un vector >> h1=sort(h) %entrega vector ordenado h1 = 1.5200 1.5700 1.6000 1.6500 1.6500 1.6800 1.7000 1.7200 1.7800 1.7800 1.8200 1.8700 >> h2=sort(h,'descend') h2 = 1.8700 1.8200 1.7800 1.7800 1.7200 1.7000 1.6800 1.6500 1.6500 1.6000 1.5700 1.5200 >> ceros=zeros(1,12) %1 fila de 12 columnas ceros = 0 0 0 0 0 0 0 0 0 0 0 0 >> unos=ones(1,n) %1 fila de n columnas unos = 1 1 1 1 1 1 1 1 1 1 1 1 >> azar=rand(1,5) % n meros al azar entre 0 y 1 (0.x) azar = 0.8147 0.9058 0.1270 0.9134 0.6324
Operaciones entre vector y escalar (n) >> v=ceros+promedio v = 1.6950 1.6950 1.6950 1.6950 1.6950 1.6950 1.6950 1.6950 1.6950 1.6950 1.6950 1.6950 >> w=unos*promedio w = 1.6950 1.6950 1.6950 1.6950 1.6950 1.6950 1.6950 1.6950 1.6950 1.6950 1.6950 1.6950 >> numeros=rand(1,3)*6 %numeros entre 0 y 5.9.... numeros = 1.1869 0.1832 4.4644 >> dados=floor(numeros)+1 % dados=ceil(numeros) dados = 2 1 5
>> plot(numeros,h,'*',numeros,v) >> ylabel('altura') >> xlabel('persona') >> title('alturas y promedio')
Operaciones entre vectores >> a=[1,2,3,4]; % ; suprime el eco (no muestra resultado) >> b=[5,6,7,8]; >> sumas=a+b >> restas=a-b sumas = restas = 6 8 10 12 -4 -4 -4 -4 >> productos=a.*b >>cuocientes=a./b productos = cuocientes = 5 12 21 32 0.2000 0.3333 0.4286 0.5000 >> potencias=a.^b potencias = 1 64 2187 65536 OJO >> productos=a*b ??? Error using ==> mtimes Inner matrix dimensions must agree.


")
")

")

")
")