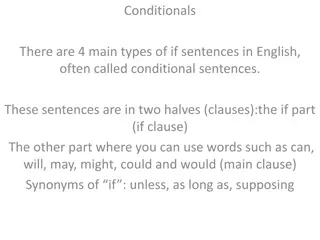
Exploring Two-Way Frequency Tables and Conditional Probabilities

Understanding two-way frequency tables, joint and marginal relative frequencies, and conditional probabilities through examples involving marbles, data organization, and car insurance quotes. Learn how to construct and interpret these tables to analyze relationships between two variables.

Download Presentation

Please find below an Image/Link to download the presentation.
The content on the website is provided AS IS for your information and personal use only. It may not be sold, licensed, or shared on other websites without obtaining consent from the author. Download presentation by click this link. If you encounter any issues during the download, it is possible that the publisher has removed the file from their server.
E N D
Presentation Transcript
Warm Up A bag contains 4 red and 2 yellow marbles. A marble is selected, kept out of the bag, and another marble is selected. Find each conditional probability of selecting the second marble. 1.P(red | red) 2.P(red | yellow) 0.6 0.8 4.P(yellow | red) 3.P(yellow | yellow) 0.2 0.4
Continued : Warm Up 5. A bag contains 4 red and 2 yellow marbles. A marble is selected, kept out of the bag, and another marble is selected. Find P(two red marbles). 0.4
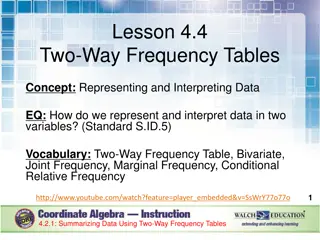
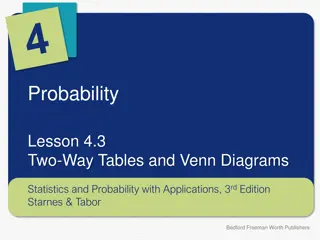
Objectives Construct and interpret two-way frequency tables of data when two categories are associated with each object being classified.
Vocabulary joint relative frequency marginal relative frequency conditional relative frequency
A two-way table is a useful way to organize data that can be categorized by two variables. Suppose you asked 20 children and adults whether they liked broccoli. The table shows one way to arrange the data. The joint relative frequencies are the values in each category divided by the total number of values, shown by the shaded cells in the table. Each value is divided by 20, the total number of individuals.
The marginal relative frequencies are found by adding the joint relative frequencies in each row and column.
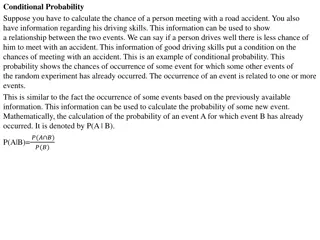
To find a conditional relative frequency , divide the joint relative frequency by the marginal relative frequency. Conditional relative frequencies can be used to find conditional probabilities.
Example 1: Finding Joint and Marginal Relative Frequencies The table shows the results of randomly selected car insurance quotes for 125 cars made by an insurance company in one week. Make a table of the joint and marginal relative frequencies.
Example 1: Continued Divide each value by the total of 125 to find the joint relative frequencies, and add each row and column to find the marginal relative frequencies. Teen 0.12 0.032 0.072 0.224 Adult 0.424 0.256 0.096 0.776 Total 0.544 0.288 0.168 1 0 acc. 1 acc. 2 + acc. Total
Check It Out! Example 1 The table shows the number of books sold at a library sale. Make a table of the joint and marginal relative frequencies.
Check It Out! Example 1 Continued Divide each value by the total of 210 to find the joint relative frequencies, and add each row and column to find the marginal relative frequencies. Fiction 0.133 0.448 0.581 Nonfiction 0.248 0.171 0.419 Total 0.381 0.619 1 Hardcover Paperback Total
Example 2: Using Conditional Relative Frequency to Find Probability A reporter asked 150 voters if they plan to vote in favor of a new library and a new arena. The table shows the results.
Example 2A Continued A. Make a table of the joint and marginal relative frequencies. Library Yes 0.14 0.38 0.52 No 0.2 0.28 0.48 Total 0.34 0.66 1 Yes No Total Arena
Example 2B Continued B. If you are given that a voter plans to vote no to the new library, what is the probability the voter also plans to say no to the new arena? 0.28 0.58 0.48
Check It Out! Example 2 The classes at a dance academy include ballet and tap dancing. Enrollment in these classes is shown in the table. 2a. Copy and complete the table of the joint relative frequencies and marginal relative frequencies.
Check It Out! Example 2 continued Ballet Yes 0.19 0.43 0.62 No 0.26 0.12 0.38 Total 0.45 0.55 1 Yes No Total Tap 2b. If you are given that a student is taking ballet, what is the probability that the student is not taking tap? 0.43 0.62 0.69 or 69%
Example 3: Comparing Conditional Probabilities A company sells items in a store, online, and through a catalog. A manager recorded whether or not the 50 sales made one day were paid for with a gift card. Use conditional probabilities to determine for which method a customer is most likely to pay with a gift card.
Example 3 Continued Gift Card Another Method 0.12 0.18 0.18 0.26 0.10 0.16 0.40 0.60 TOTAL Store Online Catalog TOTAL 0.30 0.44 0.26 1 P(gift card if in store) = 0.4 P(gift card if online) 0.41 P(gift card if by catalog) 0.38 so most likely if buying online. A customer is most likely to pay with a gift card if buying online.
Check It Out! Example 3 Francine is evaluating three driving schools. She asked 50 people who attended the schools whether they passed their driving tests on the first try. Use conditional probabilities to determine which is the best school. Use conditional probabilities to determine which is the best school.
Check It Out! Example 3 Continued Pass 0.28 0.22 0.10 Fail 0.16 0.14 0.10 TOTAL 0.44 0.36 0.20 Al s Driving Drive Time Crash Course TOTAL 0.60 0.40 1 Al s Driving has the best pass rate, about 64%, versus 61% for Drive Time and 50% for Crash Course.
Lesson Quiz: Part I 1. At a juice-bottling factory, quality-control technicians randomly select bottles and mark them pass or fail. The manager randomly selects the results of 50 tests and organizes the data by shift and result. The table below shows these results.
Lesson Quiz: Part I continued 1. 1. Make a table of the joint and marginal relative frequencies. Pass 0.28 0.2 0.22 0.7 Fail 0.1 0.08 0.12 0.3 Total 0.38 0.28 0.34 1 Morn. After. Eve. Total
Lesson Quiz: Part 2 2. Find the probability that a bottle was inspected in the afternoon given that it failed the inspection. 0.08 0.3 0.27
Lesson Quiz: Part 3 3. 3. Use conditional probabilities to determine on which shift a bottle is most likely to pass inspection. P(pass if in morning) 0.74, P(pass if in afternoon) 0.71, P(pass if in evening) 0.65, so most likely to pass in the morning