Managerial Economics: Understanding Demand Estimation
Explore the fundamental concepts of demand estimation in managerial economics, covering topics such as the definition of demand, the law of demand, price elasticity, income elasticity, cross elasticity, and more. Dr. Sumudu Perera provides insights on how quantity demanded relates to factors like price, income, related commodities, and consumer preferences.

Uploaded on Sep 26, 2024 | 0 Views
Download Presentation

Please find below an Image/Link to download the presentation.
The content on the website is provided AS IS for your information and personal use only. It may not be sold, licensed, or shared on other websites without obtaining consent from the author. Download presentation by click this link. If you encounter any issues during the download, it is possible that the publisher has removed the file from their server.
E N D
Presentation Transcript
BEC 30325: MANAGERIAL ECONOMICS Session 02 Demand Estimation (Part I) Dr. Sumudu Perera
Session Outline 2 Definition of Demand Law of Demand Price Elasticity of Demand Elasticity and Total Revenue Income Elasticity of Demand Cross Elasticity of Demand Demand Estimation Identification Problem Dr.Sumudu Perera 26/09/2024
DEMAND 3 Quantity demanded is the amount of a good that buyers are willing and able to purchase. Law of Demand The law of demand states that, other things equal, the quantity demanded of a good falls when the price of the good rises. Dr.Sumudu Perera 26/09/2024
4 Dr.Sumudu Perera 26/09/2024
DEMAND continued 5 The demand for a commodity arises from the consumers willingness and ability to purchase the commodity. Consumer demand theory postulates that the quantity demanded of a commodity is a function of or depends on the price of the commodity, the consumers income, the price of related commodities, and the tastes of the consumer. Dr.Sumudu Perera 26/09/2024
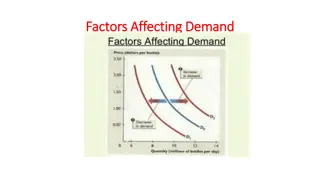
The Demand Curve 6 The Demand Curve: The Relationship between Price and Quantity Demanded The demandcurve is a graph of the relationship between the price of a good and the quantity demanded. Demand Schedule The demand scheduleis a table that shows the relationship between the price of the good and the quantity demanded. Dr.Sumudu Perera 26/09/2024
Demand Schedule and Demand Curve for Ice- Cream Price of Ice-Cream Cone $3.00 2.50 1. A decrease in price... 2.00 1.50 1.00 0.50 Quantity of 0 1 2 3 4 5 6 7 8 9 10 11 12 Ice-Cream Cones 2. ... increases quantity of cones demanded.
Market Demand versus Individual Demand 8 Market demand refers to the sum of all individual demands for a particular good or service. Graphically, individual demand curves are summed horizontally to obtain the market demand curve Dr.Sumudu Perera 26/09/2024
Elasticity 9 A measure of the responsiveness of one variable to changes in another variable It is the percentage change in one variable that arises due to a given percentage change in another variable. The elasticity measure does not depend on the units in which we measure the variables.
Own Price Elasticity of Demand 10 Own price elasticity: A measure of the responsiveness of the quantity demanded of a good to a change in the price of that good; Demand is elasticif the absolute value of the own price elasticity is greater than 1. Demand isinelasticif the absolute value of the own price elasticity is less than 1. Demand is unitary elastic if the absolute value of the own price elasticity is equal to 1.
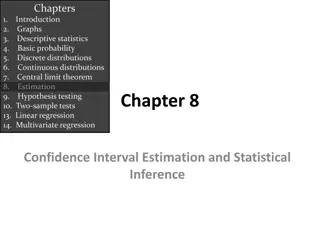
Elasticity and Total Revenue 11 If demand is elastic, an increase (decrease) in price will lead to a decrease (increase) in total revenue. If demand is inelastic, an increase (decrease) in price will lead to an increase (decrease) in total revenue. Total revenue is maximized at the point where demand is unitary elastic.
Revenue falls as price rises Revenue rises as price rises PED = -1 PED = 0
Factors Affecting the Own Price Elasticity 13 Available substitutes The more substitutes available for the good, the more elastic the demand for it. A price increase leads consumers to substitute toward another product, thus reducing considerably the quantity demanded of the good. When there are few close substitutes, demand tends to be relatively inelastic. Time Demand tends to be more inelastic in the short term than in the long term. The more time consumers have to react to a price change, the more elastic the demand for the good. Time allows the consumer to seek out available substitutes Expenditure share Goods that comprise a relatively small share of consumers budgets tend to be more inelastic than goods for which consumers spend a sizable portion of their incomes.
Cross-Price Elasticity 14 Cross-price elasticity: A measure of the responsiveness of the demand for a good to changes in the price of a related good; the percentage change in the quantity demanded of one good divided by the percentage change in the price of a related good. The cross-price elasticity is positive whenever goods are substitutes. The cross-price elasticity is negative whenever goods are complements.
Income Elasticity 15 Income elasticity: A measure of the responsiveness of the demand for a good to changes in consumer income; the percentage change in quantity demanded divided by the percentage change in income. The income elasticity is positive whenever the good is a normal good. The income elasticity is negative whenever the good is an inferior good.
Advertising Elasticity 16 The own advertising elasticity of demand for good X defines the percentage change in the consumption of X that results from a given percentage change in advertising spent on X.
Example 01: Data for Butter is given below 17 Year Price of Butter Quantity Purchased Real Income Price of Margarine 1 $.95 200 pounds $11000 $.65 2 1.10 180 11000 0.65 3 1.10 190 11500 0.65 4 1.10 200 11500 0.90 5 1.15 170 11500 0.90 Find price, income and cross price elasticities from the yearly data
Example 02 18 L .L. Bean is a catalog retailer of a wide variety of sporting goods and recreational products. Although the market response to the company's spring catalog was generally good, sales of L.L. Bean's $140 deluxe garment bag declined from 10000 and 4800 units. During this period, a competitor offered a whopping $52 off its regular $137 price on deluxe garment bags. A. Calculate the arc cross-price elasticity of demand for L.L. Bean's deluxe garment bag. B. L.L. Bean's deluxe garment bag sales recovered from 4800 units to 6000 units following a price reduction to $130 per unit. Calculate L.L. Bean's arc price elasticity of demand for this product. C. Assuming the same arc price elasticity of demand calculated in part b, determine the further price reduction necessary for L.L. Bean to fully recover lost sales (i.e., regain a volume of 10000 units).
Demand Estimation 19 Estimation attempts to quantify the links between the level of demand for a product and the variables which determine it. To use these important demand relationship in decision analysis, we need empirically to estimate the structural form and parameters of the demand function-Demand Estimation. Qdx= (P, I, Pc, Ps, T) Eg- The demand for hotel rooms depends upon: their price the price of bed and breakfast accommodation household incomes in visitors home countries natural events (the weather, foot-and-mouth disease)
20 Demand Estimation continued In general, we will seek the answer for the following qustions: How much will the revenue of the firm change after increasing the price of the commodity? How much will the quantity demanded of the commodity increase if consumers income increase What if the firms double its ads expenditure? What if the competitors lower their prices? Firms should know the answers the abovementioned questions if they want to achieve the objective of maximizing thier value.
21 The Identification Problem The demand curve for a commodity is generally estimated from market data on the quantity purchased of the commodity at various price over time (i.e. Time-series data) or various consuming units at one point in time (i.e. Cross-sectional data). Simply joinning priced-quantity observations on a graph does not generate the demand curve for a commodity. The reason is that each priced-quantity observation is given by the intersection of a different and unobserved demand and supply curve of commodity. In other words, The difficulty of deriving the demand curve for a commodity from observed priced-quantity points that results from the intersection of different and unobserved demand and supply curves for the commodity is referred to as the identification problem.
The Identification Problem 22 In the following demand curve, Observed price- quantity data points E1, E2, E3, and E4, result respectively from the intersection of unobserved demand and supply curves D1 and S1, D2 and S2, D3 and S3, and D4 and S4. Therefore, the dashed line connecting observed points E1, E2, E3, and E4 is not the demanded curve for the commodity. The derived a demand curve for the commodity, say, D2, we allow the supply to shift or to be different and correct, through regression analysis, for the forces that cause demand curve D2 to shift or to be different as can be seen at points E2, E'2. This is done by regression analysis.
23 End of the session 2 Dr.Sumudu Perera 26/09/2024