Understanding Demand and Supply in Market Economics
Explore the fundamentals of demand and supply in market economics, analyzing how prices and quantities are determined. Learn about the factors influencing demand and supply, and how various external factors impact market dynamics. Discover the principles behind the law of demand, demand curves, shifts in demand, and the distinction between change in demand and change in quantity demanded.

Download Presentation

Please find below an Image/Link to download the presentation.
The content on the website is provided AS IS for your information and personal use only. It may not be sold, licensed, or shared on other websites without obtaining consent from the author. Download presentation by click this link. If you encounter any issues during the download, it is possible that the publisher has removed the file from their server.
E N D
Presentation Transcript
Ch. 3: Demand and Supply but1 Objectives Determinants of demand and supply Use demand and supply to understand how markets determine prices and quantities make predictions about how various shocks or government intervention affects prices and quantities
Markets and Prices but1 Market any arrangement that enables buyers and sellers to get information and do business with each other. Competitive market a market that has many buyers and many sellers no single buyer or seller can influence the price. Money price of a good the amount of money needed to buy it.
Demand but1 Quantity demanded of a good or service the amount that consumers plan to buy during a particular time period at a particular price. The Law of Demand Other things remaining the same, the higher the price of a good, the smaller is the quantity demanded. The law of demand results from a substitution effect an income effect Normal versus inferior good
Demand but1 Demand the relationship between the price of the good and quantity demanded of the good. Demand curve shows the relationship between the QD of a good and its price, ceteris parabus
Law of Demand but1 A rise in the price, ceteris paribus, brings a decrease in the quantity demanded and Demand curves are downward sloping. A change in price creates a movement along the demand curve, not a change in demand. Price D # gallons per week
Demand but1 A D-curve is also Willingness-to-pay curve. Willingness to pay measures marginal benefit Price D=MB # gallons per week
Demand but1 A Change in Demand Quantity of the good that people plan to buy changes at each and every price Shift of demand curve. When demand increases, QD increases at each and every price the demand curve shifts rightward. When demand decreases, QD decreases at each and every price the demand curve shifts leftward.
Demand but1 Change in Demand vs. Change in Quantity Demanded
Factors that change demand but1 1. Prices of related goods substitute in consumption complement in consumption 2. Income Normal good Inferior good Luxury good 3. Expected future prices 4. Population 5. Taxes on buyers 6. Consumer preferences
Supply but1 Quantity supplied (QS) of a good or service the amount that producers plan to sell during a given time period at a particular price. The Law of Supply Other things remaining the same, the higher the price of a good, the greater is the quantity supplied. results from tendency for the marginal cost of producing a good or service to increase as the quantity produced increases (more later) Producers are willing to supply only if they at least cover their marginal cost of production.
Supply but1 Supply the entire relationship between the quantity supplied and the price of a good. Supply curve shows relationship between QS and price of a good, ceteris paribus.
Supply Curve but1 $ per gallon A supply curve for gasoline. A rise in the price, ceteris paribus, brings an increase in QS and a movement along the supply curve. S Gallons per day
Supply but1 A supply curve is also a minimum- supply-price curve. The greater the quantity produced, the higher is the price that producers must be offered to be willing to produce that quantity. S Gallons per day
Supply but1 A Change in Supply occurs when the quantity of the good that producers plan to sell changes at each and every price, so there is a new supply curve. When supply increases, QS increases at each and every price supply curve shifts rightward. When supply decreases, QS decreases at each and every price supply curve shifts leftward.
Supply but1 Change in supply vs. change in quantity supplied
Factors that change supply. but1 1. Prices of inputs 2. Prices of related goods produced Substitutes in production Complements in production 3. Expected future prices 4. Number of sellers 5. Taxes on Sellers 6. Technology
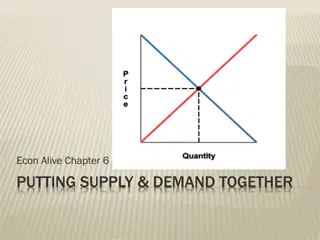
Market Equilibrium but1 Equilibrium situation in which opposing forces balance each other. occurs when the price balances the plans of buyers and sellers. Equilibrium price price at which the quantity demanded equals the quantity supplied. Equilibrium quantity quantity bought and sold at the equilibrium price.
Market Equilibrium but1 Price Adjustments If P>Pequil: a surplus forces the price down. If P<Pequil: a shortage forces the price up. At the equilibrium price, QS=QD and the price doesn t change. S D
Predicting Changes in Price and Quantity but1 Illustrate Effect on Equilibrium Price and Quantity if: a.Demand increases b.Supply increases c.Demand and supply simultaneously increase. Practice with Supply/Demand to: a.Predict effect of shock to market. b.Understand the type of shock that might have caused an observed change in P & Q.
Price controls but1 1. A price ceiling is a maximum allowable price. Results in a continuing shortage if ceiling is BELOW equilibrium price. 2. A price floor is a minimum allowable price. Results in a continuing surplus if floor is ABOVE equilibrium price.