Understanding Supply and Demand in Economics
Supply and demand play a crucial role in determining trade in economics. Buyers purchase goods and services, while sellers earn money from selling. The equilibrium price is determined by the willingness of buyers and sellers to trade. Demand encompasses the desire, willingness, and ability to buy a product or service at different prices. A demand schedule lists prices and quantities someone is willing to buy. The demand curve shows the quantity that would be bought at various prices. Utility reflects the satisfaction obtained from a good or service, with diminishing marginal utility indicating satisfaction weakens with increased consumption. Shifts in demand can be caused by non-price determinants like changes in population or consumer income.

Download Presentation

Please find below an Image/Link to download the presentation.
The content on the website is provided AS IS for your information and personal use only. It may not be sold, licensed, or shared on other websites without obtaining consent from the author. Download presentation by click this link. If you encounter any issues during the download, it is possible that the publisher has removed the file from their server.
E N D
Presentation Transcript
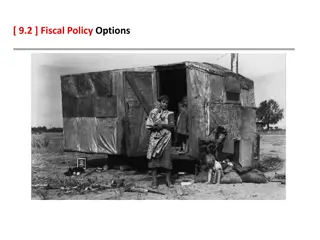
CHAPTER 20 AND 21 SUPPLY AND DEMAND
CHAPTER 20: DEMAND Supply and Demand determines trade: 1. Buyers purchase goods and services with money 2. Sellers get money for selling goods and services - The price is relative to the amount buyers are willing to trade and the amount sellers are willing to trade for both groups to be happy. - Price is determined between an equilibrium between those that demand and those that sell. What is demand? A Ferrari? A trip to Europe? Do you demand these?
DEMAND Demand: desire, willingness, and ability to buy a good or service at various prices. For demand to exist: 1) Consumer must want to buy a product 2) Be willing to buy the product 3) Have the resources available to purchase the product
DEMAND SCHEDULE Table that lists the various prices and quantities of a product or service that someone is willing to buy over a range of possible prices. Price (per bushel) Quantity Demanded for Wheat (bushels per month) 45 65 85 105 125 90 85 80 75 70 Marginal Benefit of the 85thbushel is 80. Total Revenue = price X quantity in a time period
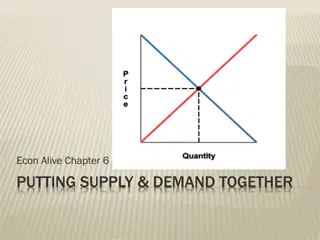
DEMAND CURVE Graph that shows the amount of a product that would be bought at all possible prices in the market. Price (vertical) and Quantity (Horizontal) Law of demand: quantity demanded and price move in opposite directions (people will buy less the more an item costs and vice versa). Market demand: the total demand of all consumers within you market.
UTILITY Utility: the pleasure, usefulness, or satisfaction one gets from a good or service (varies for each person) => the resulting feeling from using a product Marginal utility: the additional satisfaction for each additional unit consumed. Diminishing marginal utility: the principle that our additional satisfaction, or marginal utility, tends to weaken as more units of a product are consumed. - The lower the diminishing marginal utility, the better for the seller or producer
SHIFTS IN DEMAND CREATED BY A NON-PRICE DETERMINANT!!! The price remains the same, but quantity would change. - More demand => shifts to the right - Less demand => shifts to the left 1. Change in Population (number of consumers): population increase/decrease 2. Change in Consumer income 1. Normal good: I increase-D increase and I decrease- D decrease 2. Inferior good: I increase- D decrease and I decrease- D increase 3. Change in consumer s taste: what is hot (tickle me elmo, zhu-zhu pets) 4. Change in consumer s expectations: tech innovation 5. Change in substitutes (a good or service which can be used in place of another good or service): Coca-Cola and Pepsi and RC cola 6. Change in complements (an item used with another good): if price of hot dogs increases too much than demand for hot dog buns decreases)
ELASTICITY When you change the price (increase), what percentage does demand change (decrease). - The extent to which a change in price causes a change in the quantity demanded. When there are many substitutes, products are usually more elastic. Products with less substitutes are inelastic (price change has little effect on demand).
CHAPTER 21: SUPPLY Supply: refers to the maximum quantities of a good or service producers are willing to sell at all possible market prices. Supply Schedule: Table that lists the various prices and quantities of a product or service that someone is willing to produce over a range of possible prices.
SUPPLY SCHEDULE Price (per bushel) Quantity supplied (bushels/month) 115 100 85 70 55 90 85 80 75 70 What is the Law of Supply?
LAW OF SUPPLY As prices for a good increase, so will the quantity the producers are willing to supply. If prices fall, the quantity producers are willing to supply will decrease. Profit: the money or resources one receives for their goods and services over and above the costs. - Businesses want to supply enough of a product at a price which will create the greatest profit.
CHANGES IN SUPPLY (SHIFTS) Created by a non-price determinant! 1. Change in the cost of resources- P (decreases), suppliers can supply more at the same price. 2. Change in productivity- More efficient, suppliers can supply more at the same price. 3. Change in technology- changes efficiency 4. Government regulations- increase regulations, suppliers will supply less at the same price. 5. Taxes and subsidies- S increase, Q increase; T increase, Q decrease.
FINDING THE EQUILIBRIUM PRICE Price Quantity Demanded Quantity Supplied State of the Market Change in Price 90 45 115 Surplus=70 units Decrease Price 85 65 100 Surplus=35 units Decrease Price 80 85 85 EP Stay 75 105 105 Shortage=35 units Increase Price 70 125 55 Shortage=70 units Increase Price Surplus: the quantity supplied is greater than the quantity demanded (price is too high). Shortage: the amount demanded is greater than the quantity is supplied (price is too low). Equilibrium Price: the price when there is neither a surplus nor a shortage.
PRICE CONTROLS Price Floor: a restriction imposed by the government that prohibits the price from falling below a certain level. Price Ceiling: a restriction imposed by the government that prohibits a price from going above a certain level. Good or bad? Why or why not?
PRICES 1) Neutral: favor neither the producer nor the supplier. 2) Flexible: change to meet societies needs 3) Freedom of choice: price is the result of economic freedom of both suppliers and consumers.