Understanding Directed Acyclic Graphs (DAGs) for Causal Inference

Directed Acyclic Graphs (DAGs) play a crucial role in documenting causal assumptions and guiding variable selection in epidemiological models. They inform us about causal relationships between variables and help answer complex questions related to causality. DAGs must meet specific requirements like being directed, acyclic, and connected to be valid for causal inference. Concepts like mediation and confounders are essential in interpreting DAGs for understanding causal relationships in epidemiological research.

Download Presentation

Please find below an Image/Link to download the presentation.
The content on the website is provided AS IS for your information and personal use only. It may not be sold, licensed, or shared on other websites without obtaining consent from the author. Download presentation by click this link. If you encounter any issues during the download, it is possible that the publisher has removed the file from their server.
E N D
Presentation Transcript
EPID 701 Spring 2020 EPID 701 Spring 2020 R for Epidemiologists DAGs & EMM Prep: notes | HW1-4 | scratchpad Install packages: (1) dagitty, (2) ggdag, (3) contrast 2020.02.27 L15 Mike learnr.web.unc.edu
Todays Overview Today s Overview DAGs EMM More on models Homework 3: Looked good! Homework 4: Basic GLMs
Models head(births_sm) births_sm$mage_sq = births_sm$mage ^ 2 # or poly m1 = glm(formula = preterm_f ~ pnc5_f, family = binomial("identity"), data = births_sm) m2 = glm(formula = preterm_f ~ pnc5_f + smoker_f , family = binomial("identity"), data = births_sm) m3 = glm(formula = preterm_f ~ pnc5_f + smoker_f + mage, family = binomial("identity"), data = births_sm) m4 = glm(formula = preterm_f ~ pnc5_f + smoker_f + poly(mage, 2, raw = T), family = binomial("identity"), data = births_sm)
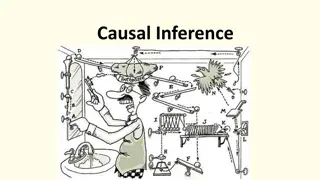
Our (toy) DAG Directed Acyclic Graphs (DAGs) inform our variable selection and treatment in models (based on their status as mediators, confounders, effect measure modifiers, etc. We will not elaborate in this class! Take the Epi sequence for more. DAG from EPID 716 / Christy Avery
What is a DAG? DAGs (Directed Acyclic Graphs) document causal assumptions / knowledge from our head or literature. They can be used to guide us to better answer questions like: Does a change in A prompt a change in B? Or the other way around? Or not in either direction, but their association is caused by some third thing?
DAG Requirements Directed: , not -- Acyclic: A B, not A B and B A Graph: Connected, not dangling*. Other disciplines, from engineering to other forms of statistical models, relax these requirements.
Colliders Inducing a biased causal association through controlling a collider is: collider stratification bias
EMM: Two notes Note that an EMM may or may not be a confounder (influencing the values of A and B directly, vs. the effect of A on B), so may not be in the DAG node network. EMMs are good for a DAG notes though! Also note that it may be rare that an exposure / intervention switches direction entirely. Effect measure modification worth acknowledging may be a matter of degree or important to report because of context - regardless of statistical interaction, p=whatever.
In Sum: Create a model, throw things in, reduce by p-value / backwards selection, or any of a number of techniques. May be good at predicting outcome from exposure and other variables. There is nuance here, but
In Sum: if we want the causal effect, we have to be intentional about what parts of this flow we block. We leave direct and indirect causal paths, and leave blocked paths with colliders (do not control!)
How do we do this? Encode the nodes and directed edges of the DAG from the literature / content knowledge By eye, hand, or software 1. document all paths between Exposure and Outcome 2. Identify whether they are already blocked (collider), backdoor (confounded), or causal (direct or indirect through a mediator) 3. Select nodes to statistically control, often ideally as few as possible, to block the open backdoor paths without blocking
A note on functional form! Remember maternal age? In order to improve precision of estimates (and acknowledge the linear assumptions of GLMs), it behooves us to model covariates as well as possible balancing parsimony and interpretation. Hence mage2 or splines of some kind. This does not apply as directly to our exposures, which we want to interpret in actionable, communicable ways!
.and a note on interpretation! Relatedly, the Table 2 fallacy suggests Reminder: Table 2 fallacy! (Westrich & Greenland 2013). If those estimates are largely uninterpretable in causal inference context, might as well let them go and model them more precisely (albeit obfuscated). Westreich, D., and S. Greenland. The Table 2 Fallacy: Presenting and Interpreting Confounder and Modifier Coefficients. American Journal of Epidemiology 177, no. 4 (February 15, 2013): 292 98. https://doi.org/10.1093/aje/kws412.
DAG critiques Reality isn t DAGGY DAGs (even if large) are a model, and so a simplified version of reality, in this particular case requiring unidirectionality and acyclic assumptions. Reality is often a system with feedback loops and inter-relationships that may not be modeled well with unidirectional models, perhaps especially with social / network processes. There are other methods! Not all nodes / edges are alike Race-ethnicity in particular is a heavily overloaded construct for causal inference (Vanderweele & Robinson 2014), reaching back to represent historical and current systemic oppression and racism, physical phenotype, experiences of cultural and ascribed identity. Parts of this construct may have different causal relationships. Break apart if you can, and regardless, be mindful / nuanced in your interpretation. Not always interested in causal effects Prediction, classification, association, other techniques have a place in a public health toolbox. VanderWeele, Tyler J., and Whitney R. Robinson. On the Causal Interpretation of Race in Regressions Adjusting for Confounding and Mediating Variables: Epidemiology 25, no. 4 (July 2014): 473 84. doi:10.1097/EDE.0000000000000105.
Our (toy) DAG Directed Acyclic Graphs (DAGs) inform our variable selection and treatment in models (based on their status as mediators, confounders, effect measure modifiers, etc. We will not elaborate in this class! Take the Epi sequence for more. DAG from EPID 716 / Christy Avery
Lets Try: Dagitty Check it out here: www.dagitty.net Premade DAG for you: dagitty.net/moAh6a6
DAGs in R The online dagitty tool (http://www.dagitty.net/dags.html#) exports R code for the dagitty package. Can be directly downloaded into R! The new ggdag package is a beefed-up version using tidy data structures we can recognize.
Lets Try: DAGs in R with dagitty dagitty e.g.: http://www.dagitty.net/dags.html?id=oAh6a6
Lets Try: DAGs in R with dagitty dagitty library(dagitty) birth_daggity = downloadGraph("dagitty.net/moAh6a6") # ^ From the internet! birth_daggity plot(birth_daggity)
Lets Try: DAGs in R with dagitty dagitty # Imagine! run a model driven by a DAG! Or tweak the dag and rerun the model! :p > dagitty::adjustmentSets(birth_daggity) { Maternal_Age, Maternal_Smoking, Race_Ethnicity } > minimal_adjustment_set = dagitty::adjustmentSets(birth_daggity, type="minimal")[[1]] > minimal_adjustment_set [1] "Maternal_Age" "Maternal_Smoking" "Race_Ethnicity" > str(birth_daggity) # < DAGs are messy though. :/ 'dagitty' Named chr "dag {\nChild_Gender [pos=\"0.111,- 0.146\"]\nEarlyPNC [exposure,pos=\"-0.366,- 0.090\"]\nMaternal_Age [pos=\"-0.5"| __truncated__ >
Lets Try: DAGs in R with ggdag ggdag tidy_dagitty() ggdag(dag_df) + theme_dag() gets you a nice ggplot2 geometries, edit plot as usual See: https://cran.r- project.org/web/packages/ggdag/vignettes/intro- to-ggdag.html And: https://github.com/malcolmbarrett/ggdag
Lets Try: DAGs in R with ggdag ggdag > library(ggdag) > > dag_df = tidy_dagitty(birth_daggity) > str(dag_df) List of 2 $ data:Classes tbl_df , tbl and 'data.frame': ..$ name : chr [1:15] "Child_Gender" "EarlyPNC" "Maternal_Age" "Maternal_Age" ... ..$ x : num [1:15] 0.111 -0.366 -0.576 -0.576 -0.576 -0.48 -0.48 -0.619 -0.619 -0.619 ... ..$ y : num [1:15] -0.146 -0.09 -0.091 -0.091 -0.091 0.022 0.022 -0.051 -0.051 -0.051 ... ..$ direction: Factor w/ 3 levels "<-","->","<->": 2 2 2 2 2 2 2 2 2 2 ... ..$ to : chr [1:15] "Preterm_Birth" "Preterm_Birth" "EarlyPNC" "Maternal_Smoking" ... ..$ xend : num [1:15] -0.147 -0.147 -0.366 -0.48 -0.147 -0.366 -0.147 -0.366 -0.576 -0.48 ... ..$ yend : num [1:15] -0.051 -0.051 -0.09 0.022 -0.051 -0.09 -0.051 -0.09 -0.091 0.022 ... ..$ circular : logi [1:15] FALSE FALSE FALSE FALSE FALSE FALSE ... $ dag : 'dagitty' Named chr "dag {\nChild_Gender [pos=\"0.111,-0.146\"]\nEarlyPNC [exposure,pos=\"-0.366,-0.090\"]\nMaternal_Age [pos=\"-0.5"| __truncated__ - attr(*, "class")= chr "tidy_dagitty" > 15 obs. of 8 variables:
Lets Try: DAGs in R with ggdag ggdag plot(dag_df) # nope! ggdag(dag_df %>% mutate(name = str_trunc(name, 5))) + theme_dag_blank()
Lets Try: DAGs in R with ggdag ggdag ggdag_adjustment_set(dag_df) + theme_dag_blank() + # Hey that's nice! geom_dag_text(color="black") # gives us geometries as usual
Practical Uses R may be helpful for quickly changing and rerunning for minimal sets a few different DAG scenarios. Probably better than hand. Nice pair with dagitty website. Maybe useful for SEM? I dunno. But you can stick your DAGs in papers / R Markdown, make ggplots of them, etc.
Other Packages If you do this a lot, find your favorite! R skills let you translate data structures across packages as you need to. dagitty * ggdag: Today! DiagrammeR: Prettier, but no adjustment sets? https://donlelek.github.io/2015-03-31-dags-with-r/ dagR: Prettier and adjustment sets, but funny syntax? http://rstudio-pubs- static.s3.amazonaws.com/2609_e3d86d0748c04eb18d5f56d6 a99feb3f.html Maybe new packages?
In other words A continuation of modeling: How do we get group-specific effect estimates and confidence intervals from models when we have EMM? Also: a recursion primer
Review 1. We ve looked at a Directed Acyclic Graph to identify model covariates to control to assess the causal relationship of early prenatal care on preterm birth. We know EMM won t show up on the DAG. 2. We ve constructed Generalized Linear Models for risk difference (also looked at RRs and ORs) without EMM. 3. We ve looked at crude EMM using dplyr:: and table(). Moderate modification? 4. Now we want modeled, stratum-specific effect estimates and CIs controlling for our other covariates (smoking, maternal age). We want a full EMM model.
Model Specification 1: Crude Risk Preterm = ?0+ ?1 ???5 Variable coefficients like ?1 (slopes) represent a linear change in risks (a risk difference) for a 1 unit increase in their associated variable. ?0: Risk of preterm with no early prenatal care ?1: Additional risk (risk difference) with early prenatal care
Model Specification 2 Risk Preterm = ?0+ ?1 ???5 + ?2 ?????? Coefficient slopes represent a linear change in risks (a risk difference) for a 1 unit increase in their associated variable. ?0: Risk of preterm with no early prenatal care ?1: Additional risk (risk difference) with early prenatal care (expect negative RD since protective) ?2: Additional risk (RD) with smoking status (note: no interaction term, so this additional risk is regardless of PNC5 status)
Model Specification 3 Risk Preterm = ?0+ ?1 ???5 + ?? ?????? + ?3?????? + ?4???? + ?5????_?? No interaction term but since race-ethnicity has multiple levels, so that 2 is really a vector of coefficients. Now ?0 is the baseline risk for White non-Hispanic mothers, each 2? for non-referent levels of race-ethnicity (AA, WH, AI/AN, other) is the increased risk of preterm birth by race-ethnicity status of the mother .*
Model Specification 3 Risk Preterm = ?0+ ?1 ???5 + ?? ?????? + ?4?????? + ?5???? + ?6????_?? * SORT OF. Remember the Table 2 Fallacy when not looking at EMM: we didn t draw our DAG to properly estimate these other coefficients. But may still useful to think about their statistical (non-causal) interpretation.
Full Model Specification w/ EMM Risk Preterm = ?0+ ?1 ???5 + ?? ?????? + ?????5 ?????? + ?4 ?????? + ?5 ???? + ?6 ????_?? Coefficient slopes represent a linear change in risks (a risk difference) for a 1 unit increase in their associated variable.
Coding schemes R s default for expanding unordered factors in a model is indicator coding: R breaks up factors in models to all be referent to a baseline level (set by factor() or fct_* functions!). This means you need (n-1) indicator levels to describe n levels of a factor.
Full Model Specification w/ EMM Risk Preterm = ?0+ ?1 ???5??? + ?2 ?????? ?? + ?6???5 ?????? ?? + ?3 ?????? ?? + ?7???5 ?????? ?? + ?4 ?????? ???? + ?8???5 ?????? ???? + ?5 ?????? ????? + ?9???5 ?????? ????? + ?10????????? + ?11???? + ?12????_??
Full Model Specification w/ EMM Risk Preterm = ?0+ ?1 ???5??? + ?2 ?????? ?? + ?6???5 ?????? ?? + ?3 ?????? ?? + ?7???5 ?????? ?? + ?4 ?????? ???? + ?8???5 ?????? ???? + ?5 ?????? ????? + ?9???5 ?????? ????? + ?10????????? + ?11???? + ?12????_?? map(births[, map_lgl(births, is.factor)], levels) # ^ level check purrr mfull_emm_rd = glm(data=births, preterm_f ~ pnc5_f * raceeth_f + smoker_f + mage + mage_sq, family=binomial(link="identity"))
> mfull_emm_rd = glm(data=births, + + + Detail preterm_f ~ pnc5_f * raceeth_f + smoker_f + mage + mage_sq, family=binomial(link="identity")) > broom::tidy(mfull_emm_rd) # A tibble: 13 x 5 term estimate std.error statistic p.value <chr> 1 (Intercept) 2 pnc5_fEarly PNC 0.0221 3 raceeth_fOther 4 raceeth_fWhite Hispanic -0.0104 5 raceeth_fAfrican American -0.0589 6 raceeth_fAmerican Indian or Alaska Native -0.0673 7 smoker_fSmoker -0.0331 8 mage 0.0135 9 mage_sq 10 pnc5_fEarly PNC:raceeth_fOther 11 pnc5_fEarly PNC:raceeth_fWhite Hispanic 0.0113 12 pnc5_fEarly PNC:raceeth_fAfrican American 0.00353 13 pnc5_fEarly PNC:raceeth_fAmerican Indian or Alaska Native 0.0213 > table(interaction(births$pnc5_f, births$raceeth_f)) # : = interaction() <dbl> <dbl> <dbl> 29.1 3.23 -1.17 -0.422 6.73e- -5.41 -1.62 -7.77 7.78 -8.02 -0.489 6.25e- 0.440 6.60e- 0.310 7.56e- 0.492 6.23e- <dbl> 0.725 0.0249 0.00683 0.0112 0.0246 0.0109 0.0416 0.00427 0.00174 9.21e-187 1.22e- 2.44e- 3 1 1 8 1 -0.0130 6.15e- 1.06e- 7.96e- 15 7.15e- 15 1.09e- 15 -0.000246 0.0000306 -0.00570 0.0117 0.0256 0.0114 0.0433 1 1 1 1 No Early PNC.White non-Hispanic Early PNC.White non-Hispanic 2105 No Early PNC.Other 1240 No Early PNC.White Hispanic Early PNC.White Hispanic 175 No Early PNC.African American Early PNC.African American 1836 No Early PNC.American Indian or Alaska Native Early PNC.American Indian or Alaska Native 86 32523 Early PNC.Other 8626 1387 12768 783
Full Model Specification w/ EMM Under that coding schema ?0 is no longer the baseline risk (no PNC) for all groups it s the baseline risk for White non-Hispanic mothers*. ?2,3,4,5 are the increment in risk for each race-ethnicity status (compared to WnH) without prenatal care*. ?6,7,8,9 are the increment in risk by each race-ethnicity status (compared to WnH) with prenatal care*. * adjusting for other covariates like smoking and mage as specified in the model
Contrasts So if we want the group-specific RDs by race, ethnicity, we could imagine subtracting one equation from another. Many terms drop out, leaving: ?1: ?1+ ?6: ?1+ ?7: ?1+ ?8: ?1+ ?9: Effect (RD) of PNC5 for WnH moms Effect (RD) of PNC5 for AA moms Effect (RD) of PNC5 for WH moms Effect (RD) of PNC5 for AI/AN moms Effect (RD) of PNC5 for RE:Other moms
We can get these point-estimates by hand a few ways # Point estimates by hand, a few ways mfull_emm_rd$coefficients[2] #WnH RD_WnH = mfull_emm_rd$coefficients["pnc5_fPNC starts in first 5 mo"] #WnH RD_WnH + mfull_emm_rd$coefficients["pnc5_fPNC starts in first 5 mo:raceeth_fAA"] #AA sum(mfull_emm_rd$coefficients[c(2,10)]) # AA sum(mfull_emm_rd$coefficients[c(2,11)]) # WH sum(coef(mfull_emm_rd)[c(2,12)]) # AI/AN sum(coef(mfull_emm_rd)[c(2,13)]) # Other
But what about the CIs? Can't quite make it from the individual coefficients.


 DAG")


 DAG")