Advanced Techniques in Regression Analysis
Explore various advanced techniques in regression analysis, including structural variations, interactions, and nonlinearities. Learn how to handle situations where the effect of one explanatory variable depends on another, or when the relationship between variables bends non-linearly. Discover tricks to introduce artificial explanatory variables and interpret regression results effectively, with practical examples.

Download Presentation

Please find below an Image/Link to download the presentation.
The content on the website is provided AS IS for your information and personal use only. It may not be sold, licensed, or shared on other websites without obtaining consent from the author. Download presentation by click this link. If you encounter any issues during the download, it is possible that the publisher has removed the file from their server.
E N D
Presentation Transcript
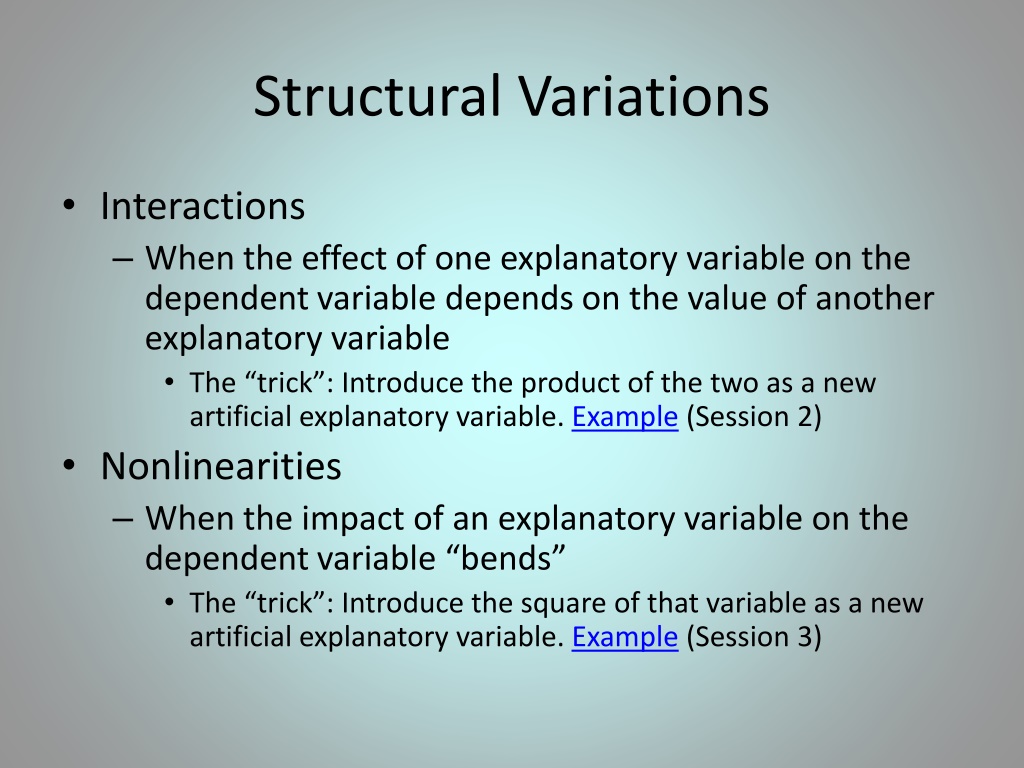
Structural Variations Interactions When the effect of one explanatory variable on the dependent variable depends on the value of another explanatory variable The trick : Introduce the product of the two as a new artificial explanatory variable. Example (Session 2) Nonlinearities When the impact of an explanatory variable on the dependent variable bends The trick : Introduce the square of that variable as a new artificial explanatory variable. Example (Session 3)
Interactions: Summary When the effect (i.e., the coefficient) of one explanatory variable on the dependent variable depends on the value of another explanatory variable Signaled only by judgment The trick : Introduce the product of the two as a new artificial explanatory variable. After the regression, interpret in the original conceptual model. For example, Cost = a + (b1+b2 Age) Mileage + (rest of model) The latter explanatory variable (in the example, Age) might or might not remain in the model Cost: We lose a meaningful interpretation of the beta-weights
Nonlinearity: Summary When the direct relationship between an explanatory variable and the dependent variable bends Signaled by a U in a plot of the residuals against an explanatory variable The trick : Introduce the square of that variable as a new artificial explanatory variable: Y = a + bX + cX2+ (rest of model) One trick can capture 6 different nonlinear shapes Always keep the original variable (the linear term, with coefficient b , allows the parabola to take any horizontal position) c (positive = upward-bending parabola, negative = downward- bending) -b/(2c) indicates where the vertex (either maximum or minimum) of the parabola occurs Cost: We lose a meaningful interpretation of the beta-weights
Examples from the Sample Exams Regression: Revenue Caligula s Castle: Sex Ind 1.43767 constant -1224.84 62.37502 Age Age2 -0.5201 -121.899 1.992615 Sex Direct Indirect 0.85276 coefficient Revenuepred = -1224.82 + 62.37 Age 0.5201 Age2 121.9 Sex + 1.99 Direct + (0.8527+1.4377 Sex) Indirect revenue / $ incentive direct indirect Men (Sex=0) $1.99 $0.85 Women (Sex=1) $1.99 $2.29 Give direct incentives (house chips, etc.) to men Give indirect incentives (flowers, meals) to women The Age effect on Revenue is greatest at Age = -(62.37)/(2(-0.5201)) = 59.96 years
Examples from the Sample Exams Regression: CustSat Hans and Franz: Size Franz? constant 84.4016931 -0.8666595 -0.0556165 -5.6022949 -40.084506 8.77474654 Wait Wait2 Size Franz? coefficient CustSatpred = 84.40 0.8667 Wait 0.0556 Wait2 5.602 Size + (-40.0845+8.7747 Size) Franz? Set Franz? = 0 (assign Hans) when the party size is < 40.0845/8.7747 = 4.568 Customers anger grows more quickly the longer they wait: c < 0, and b = -(-0.8667)/(2 (-0.0556)) = -7.794 (i.e., in negative territory).