Trends in National Health Expenditures and Care Costs, 1960-2010
National health expenditures per capita and as a share of GDP from 1960 to 2010, along with average annual growth rates, show the evolving landscape of healthcare spending in the U.S. The data reveals changing patterns in healthcare expenditure and outlines the concentration of health care spending among different income groups in 2009. A comparison of per capita health care expenditures among selected countries provides an international perspective on health care costs.
- National health expenditures
- Healthcare spending trends
- Per capita expenditures
- Health care costs
- U.S. healthcare

Download Presentation

Please find below an Image/Link to download the presentation.
The content on the website is provided AS IS for your information and personal use only. It may not be sold, licensed, or shared on other websites without obtaining consent from the author. Download presentation by click this link. If you encounter any issues during the download, it is possible that the publisher has removed the file from their server.
E N D
Presentation Transcript
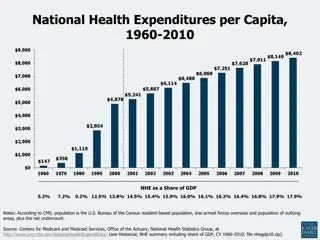
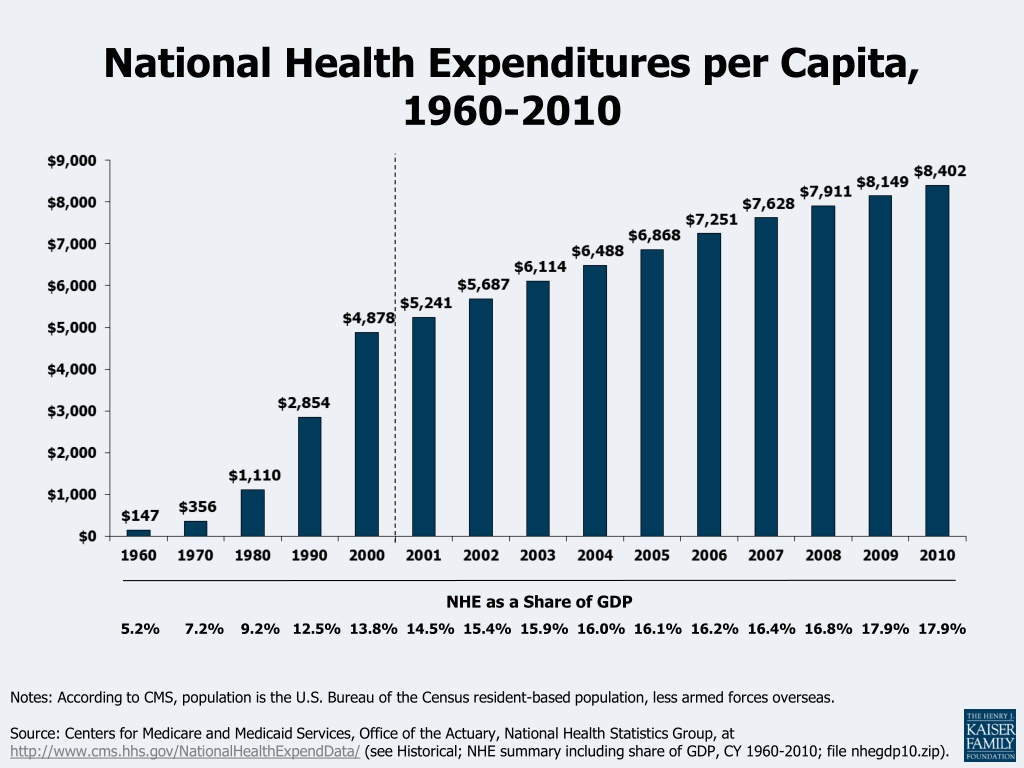
National Health Expenditures per Capita, 1960-2010 NHE as a Share of GDP 5.2% 7.2% 9.2% 12.5% 13.8% 14.5% 15.4% 15.9% 16.0% 16.1% 16.2% 16.4% 16.8% 17.9% 17.9% Notes: According to CMS, population is the U.S. Bureau of the Census resident-based population, less armed forces overseas. Source: Centers for Medicare and Medicaid Services, Office of the Actuary, National Health Statistics Group, at http://www.cms.hhs.gov/NationalHealthExpendData/ (see Historical; NHE summary including share of GDP, CY 1960-2010; file nhegdp10.zip).
Average Annual Growth Rates for NHE and GDP, Per Capita, for Selected Time Periods Projected Source: Historical data from Centers for Medicare and Medicaid Services, Office of the Actuary, National Health Statistics Group, January 2012, at http://www.cms.hhs.gov/NationalHealthExpendData/ (see Historical; NHE summary including share of GDP, CY 1960-2010; file nhegdp10.zip). Projections from Centers for Medicare and Medicaid Services, Office of the Actuary, National Health Statistics Group, July 2011, National Health Expenditures 2010-2020, Table 1, https://www.cms.gov/NationalHealthExpendData/downloads/proj2010.pdf.
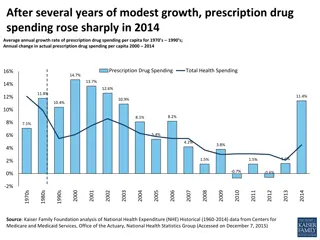
Average Annual Percent Change in National Health Expenditures, 1960-2010 Source: Kaiser Family Foundation calculations using NHE data from Centers for Medicare and Medicaid Services, Office of the Actuary, National Health Statistics Group, at http://www.cms.hhs.gov/NationalHealthExpendData/ (see Historical; National Health Expenditures by type of service and source of funds, CY 1960-2010; file nhe2010.zip).
Per Capita Total Current Health Care Expenditures, U.S. and Selected Countries, 2009 ^OECD estimate. *Break in series. Notes: Amounts in U.S.$ Purchasing Power Parity, see http://www.oecd.org/std/ppp; includes only countries over $2,500. OECD defines Total Current Expenditures on Health as the sum of expenditures on personal health care, preventive and public health services, and health administration and health insurance; it excludes investment. Source: Organisation for Economic Co-operation and Development. OECD Health Data: Health Expenditures and Financing , OECD Health Statistics Data from internet subscription database. http://www.oecd-ilibrary.org, data accessed on 01/10/12.
Concentration of Health Care Spending in the U.S. Population, 2009 Percent of Total Health Care Spending ( $51,951) ( $17,402) ( $9,570) ( $6,343) ( $4,586) ( $851) (<$851) Note: Dollar amounts in parentheses are the annual expenses per person in each percentile. Population is the civilian noninstitutionalized population, including those without any health care spending. Health care spending is total payments from all sources (including direct payments from individuals and families, private insurance, Medicare, Medicaid, and miscellaneous other sources) to hospitals, physicians, other providers (including dental care), and pharmacies; health insurance premiums are not included. Source: Kaiser Family Foundation calculations using data from U.S. Department of Health and Human Services, Agency for Healthcare Research and Quality, Medical Expenditure Panel Survey (MEPS), Household Component, 2009.
Distribution of Average Spending Per Person, 2009 Average Spending Per Person Age (in years) <5 $2,468 5-17 1,695 18-24 1,834 25-44 2,739 45-64 5,511 65 or Older 9,744 Sex Male $3,559 Female 4,635 Note: Population is the civilian noninstitutionalized population, including those without any health care spending. Health care spending is total payments from all sources (including direct payments from individuals and families, private insurance, Medicare, Medicaid, and miscellaneous other sources) to hospitals, physicians, other providers (including dental care), and pharmacies; health insurance premiums are not included. Source: Kaiser Family Foundation calculations using data from U.S. Department of Health and Human Services, Agency for Healthcare Research and Quality, Medical Expenditure Panel Survey (MEPS), 2009.
Distribution of National Health Expenditures, by Type of Service (in Billions), 2010 Nursing Care Facilities & Continuing Care Retirement Communities, $143.1 (5.5%) NHE Total Expenditures: $2,593.6 billion Note: Other Personal Health Care includes, for example, dental and other professional health services, durable medical equipment, etc. Other Health Spending includes, for example, administration and net cost of private health insurance, public health activity, research, and structures and equipment, etc. Source: Kaiser Family Foundation calculations using NHE data from Centers for Medicare and Medicaid Services, Office of the Actuary, National Health Statistics Group, at http://www.cms.hhs.gov/NationalHealthExpendData/ (see Historical; National Health Expenditures by type of service and source of funds, CY 1960-2010; file nhe2010.zip).
Percent Distribution of Source of Funds for Selected Personal Health Care Services, 1970 and 2010 1970 2010 1970 2010 1970 2010 1970 2010 Nursing Care Facilities & Continuing Care Retirement Communities Physician & Clinical Services Retail Prescription Drugs Hospital Care Notes: Medicare and Medicaid were enacted in 1965; by January 1970, all states but two were participating in Medicaid. Out-of-Pocket includes direct spending by consumers for all health care goods and services not covered by insurance, except for health care premiums. Priv. Health Ins. includes premiums paid to health insurance plans and the net cost of private health insurance (administrative costs, reserves, taxes, and profits or losses). Other includes Other Public Health Insurance Programs (CHIP, Depts. of Defense and of Veterans Affairs) and Other Third Party Payers (e.g., worksite health care, other private revenues, workers compensation, maternal/child health, other state and local programs, etc.). Source: Centers for Medicare and Medicaid Services, Office of the Actuary, National Health Statistics Group at https://www.cms.gov/NationalHealthExpendData/ (see Historical; NHE Web tables, Tables 7, 8, 11, 12).
Percent Distribution of National Health Expenditures, by Source of Funds, 1960-2010 Notes: Medicare and Medicaid were enacted in 1965; by January 1970, all states but two were participating in Medicaid. Starting with 2009 NHE data, CMS revised the Source of Funds measure from a classification that was either public or private to one that is more program-based. CMS s rational was that financing arrangements have become more complex and the lines between public and private payers have become blurred as a single program may have federal, state, local, and private funding. As a result, the category Other Third Party Payers includes both public and private programs and also some programs that receive funds from both public and private sources, such as Workers Compensation, Worksite Health Care, and School Health. Other Pub. Ins. Programs includes CHIP, the Department of Defense, and the Department of Veterans Affairs. Source: Kaiser Family Foundation calculations using NHE data from Centers for Medicare and Medicaid Services, Office of the Actuary, National Health Statistics Group, at http://www.cms.hhs.gov/NationalHealthExpendData/ (see Historical; National Health Expenditures by type of service and source of funds, CY 1960-2010; file nhe2010.zip).
Annual Percent Change in National Health Expenditures, by Selected Sources of Funds, 1960-2010 Notes: This figure omits national health spending that belongs in the categories of Other Public Insurance Programs, Other Third Party Payers and Programs, Public Health Activity, and Investment, which together represented about 20% of total national health spending in 2010. Medicare and Medicaid were enacted in 1965; by January 1970, all states but two were participating in Medicaid. Implementation of the Medicare Part D prescription drug benefit was the major cause of the 2006 increase in Medicare spending and decrease in Medicaid spending (Medicare replaced Medicaid drug coverage for dual eligibles). Source: Kaiser Family Foundation calculations using NHE data from Centers for Medicare and Medicaid Services, Office of the Actuary, National Health Statistics Group, at http://www.cms.hhs.gov/NationalHealthExpendData/ (see Historical; National Health Expenditures by type of service and source of funds, CY 1960-2010; file nhe2010.zip).
Cumulative Percent Change in National Health Expenditures, by Selected Sources of Funds, 2000-2010 Notes: This figure omits national health spending that belongs in the categories of Other Public Insurance Programs, Other Third Party Payers and Programs, Public Health Activity, and Investment, which together represent about 20% of total national health spending in 2010. Medicare and Medicaid were enacted in 1965; by January 1970, all states but two were participating in Medicaid. Source: Kaiser Family Foundation calculations using NHE data from Centers for Medicare and Medicaid Services, Office of the Actuary, National Health Statistics Group, at http://www.cms.hhs.gov/NationalHealthExpendData/ (see Historical; National Health Expenditures by type of service and source of funds, CY 1960-2010; file nhe2010.zip).
Percent Distribution of National Health Expenditures, by Type of Sponsor, 1987, 2000, 2010 Federal Private Business State & Local Household Other Private Revenues 68.2% 64.5% 55.1% 44.9% 35.5% 31.8% Government Private 1987 (Total = $519.1 billion) Government Private 2000 (Total = $1,377.2 billion) Government Private 2011 (Total = $2,700.7 billion) Notes: Starting with the 2009 NHE data, CMS expanded their focus on spending by Type of Sponsor, which provides estimates of the individual, business, or tax source that is behind each Source of Funds category and is responsible for financing or sponsoring the payments. Federal and State & Local includes government contributions to private health insurance premiums and to the Medicare Hospital Insurance Trust Fund through payroll taxes, Medicaid program expenditures including buy-in premiums for Medicare, and other state & local government programs. Private Business includes employer contributions to private health insurance, the Medicare Hospital Insurance Trust Fund through payroll taxes, workers compensation insurance, temporary disability insurance, worksite health care. Household includes contributions to health insurance premiums for private health insurance, Medicare Part A or Part B, out-of-pocket costs. Other Private Revenues includes philanthropy, structure & equipment, non-patient revenues. Source: Centers for Medicare and Medicaid Services, Office of the Actuary, National Health Statistics Group at https://www.cms.gov/NationalHealthExpendData/ (see Historical; NHE Web tables, Table 5).
Annual Percent Change in National Health Expenditures, by Type of Sponsor, 1988-2010 1988 2000 2005 2006 2007 2008 2009 2010 Private Business Employer Contribution to Private Health Insurance Premiums Employer Contribution to Medicare Hospital Trust Insurance Trust Fund Workers Compensation and Temporary Disability Insurance and Worksite Health Care Household Employee Contribution to Private Health Insurance Premiums and Individual Policy Premiums Employee and Self-Employment Contributions and Voluntary Premiums paid to Medicare Hospital Insurance Trust Fund Premiums paid by Individuals to Medicare Supplementary Medical Insurance Trust Fund and Preexisting Condition Insurance Plan Out-of-Pocket Health Spending Federal Government Employer Contribution to Private Health Insurance Premiums Employer Contribution to Medicare Hospital Insurance Trust Fund Adjusted Medicare Medicaid State & Local Government Employer Contribution to Private Health Insurance Premiums Employer Contribution to Medicare Hospital Insurance Trust Fund Medicaid 1 15.4% 6.5% 10.2% 8.2% 6.4% 5.6% 2.6% 6.5% 4.6% 5.2% 1.9% 1.9% 1.8% -6.2% 0.5% 2.5% 14.9% 8.9% 5.6% 1.1% -0.8% -2.7% -8.1% 1.5% 2 20.2% 7.5% 5.8% 6.4% 4.9% 8.9% 1.5% 2.7% 3 6.7% 10.0% 5.5% 7.3% 5.5% 2.6% -3.5% 3.7% 42.0% 9.7% 0.1% 5.9% 18.0% 5.8% 26.1% 3.3% 10.1% 5.6% 9.6% 2.3% 4.8% 0.2% 8.3% 1.8% 32.1% 6.3% -4.8% 11.4% 8.2% 5.0% -2.7% 8.9% 7.3% 2.3% 12.0% 3.4% 5.0% 2.9% 34.8% -1.6% 1.5% 3.0% 8.0% 6.8% 2.0% 5.7% 14.4% 9.1% 6.5% 4.5% 19.5% 21.8% 6.3% 2.8% 7.0% 9.2% 4 20.5% 9.1% 7.4% 11.0% 6.7% 9.3% 9.3% 4.3% 11.7% 9.4% 5.4% 1.0% 6.6% 6.9% 5.9% 2.3% 4.0% 0.3% -10.2% 5.4% 2.2% 4.9% 1.0% 4.2% 5 1 Excludes Medicare Retiree Drug Subsidy payments to private plans beginning in 2006. 2 Excludes subsidized COBRA payments in 2009 and 2010. 3 Includes one-half of self-employment contribution to Medicare Hospital Insurance Trust Fund and taxation of Social Security benefits. 4 Excludes Medicaid buy-in premiums for Medicare. Includes Retiree Drug Subsidy payments to private and state and local plans beginning in 2006. 5 Includes Medicaid buy-in premiums for Medicare. Source: Centers for Medicare and Medicaid Services, Office of the Actuary, National Health Statistics Group, National Health Expenditures 2010: Sponsor Highlights, Table 2, https://www.cms.gov/NationalHealthExpendData/downloads/sponsors.pdf.
Putting Off Care Because of Cost Percent who say they or another family member living in their household have done each of the following in the past 12 months because of the cost: Relied on home remedies or over-the-counter drugs instead of going to see a doctor Skipped dental care or checkups Put off or postponed getting health care needed Not filled a prescription for a medicine Skipped a recommended medical test or treatment Cut pills in half or skipped doses of medicine Had problems getting mental health care Yes to any of the above Source: Kaiser Family Foundation Health Tracking Poll (conducted August 10-15, 2011).
Cumulative Increases in Health Insurance Premiums, Workers Contributions to Premiums, Inflation, and Workers Earnings, 2000-2010 Notes: Health insurance premiums and worker contributions are for family premiums based on a family of four. Source: Kaiser/HRET Survey of Employer-Sponsored Health Benefits, 1999-2011. Bureau of Labor Statistics, Consumer Price Index, U.S. City Average of Annual Inflation (April to April), 1999-2011. Bureau of Labor Statistics, Seasonally Adjusted Data from the Current Employment Statistics Survey, 1999-2011 (April to April).
Average Annual Worker and Employer Contributions to Premiums and Total Premiums for Family Coverage, 1999-2011 $15,073* $13,770* $13,375* $12,680* $12,106* $11,480* $10,880* $9,950* $9,068* $8,003* $7,061* $6,438* $5,791 * Estimate is statistically different from estimate for the previous year shown (p<.05). Source: Kaiser/HRET Survey of Employer-Sponsored Health Benefits, 1999-2011.
Distribution of Health Coverage Costs as a Percentage of Payroll for Employees with Access to Coverage, 1999-2010 Source: Kaiser Family Foundation calculations based on data from the National Compensation Survey, 1999-2010, conducted by the Bureau of Labor Statistics.
Average Out-of-Pocket Health Services Expenses and Percent Increases, 1996 and 2009 Nonelderly Uninsured 102% Nonelderly with Private Insurance 80% Below the Federal Poverty Line 66% Poverty Line Through 125% of Poverty 85% Age 65 and Older 46% Perceived Poor Health Status 61% Total 73% Note: Percents are the percent increase from 1996 to 2009. Dollar amounts and percentages do not include health insurance premiums. Source: Agency for Healthcare Research and Quality, Medical Expenditure Panel Survey, Table 1.1, Total Health Services Median and Mean Expenses per Person with Expense and Mean Expenses by Source of Payment, 1996 and 2009, http://meps.ahrq.gov/mepsweb/data_stats/quick_tables_results.jsp?component=1&subcomponent=0&tableSeries=1&year=- 1&SearchMethod=1&Action=Search.
Prevalence of High Out-of-Pocket Burdens Among the Nonelderly, by Chronic Condition Status, 2001, 2006, and 2008 Percent with Total Burden > 10% of Income Note: Percentages include health insurance premiums. Source: Peter J. Cunningham, Center for Studying Health Systems Change, calculations using 2001, 2006, and 2008 Medical Expenditure Panel Surveys, presented at The National Academies Workshop on Measuring Medical Care Economic Risk, September 8, 2011.
Cumulative Change in Single and Family Health Insurance Premiums and Federal Poverty Level, 1996-2010 * * *No data are available for 2007 due to MEPS transition from retrospective to current data collection. Note: Family premium percentages were calculated based on a family of four. In 2009 and 2010, the federal poverty level for a family of four was $22,050. Source: Premium data from Agency for Healthcare Research and Quality, Medical Expenditure Panel Survey, private sector data from Insurance Component, 1996-2010, at http://meps.ahrq.gov/mepsweb/. Federal Poverty Level based on HHS Federal Poverty Guidelines (1996 through 2010) at http://aspe.hhs.gov/poverty/figures-fed-reg.shtml; rate of growth based on change for one person (change for a four-person family would be 41.3% rather than 39.9% over the period).