Overview of U.S. Health Care Expenditure Trends
Analysis of U.S. health care expenditure trends from 1960 to 2010, including per capita spending, share of GDP, concentration of spending in different income brackets, growth rates compared to GDP, and impact of cost on access to care. Data reveals the increasing financial burden on individuals, disparities in spending distribution, and challenges faced by households in accessing necessary health services due to costs.

Download Presentation

Please find below an Image/Link to download the presentation.
The content on the website is provided AS IS for your information and personal use only. It may not be sold, licensed, or shared on other websites without obtaining consent from the author. Download presentation by click this link. If you encounter any issues during the download, it is possible that the publisher has removed the file from their server.
E N D
Presentation Transcript
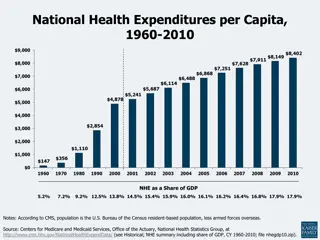
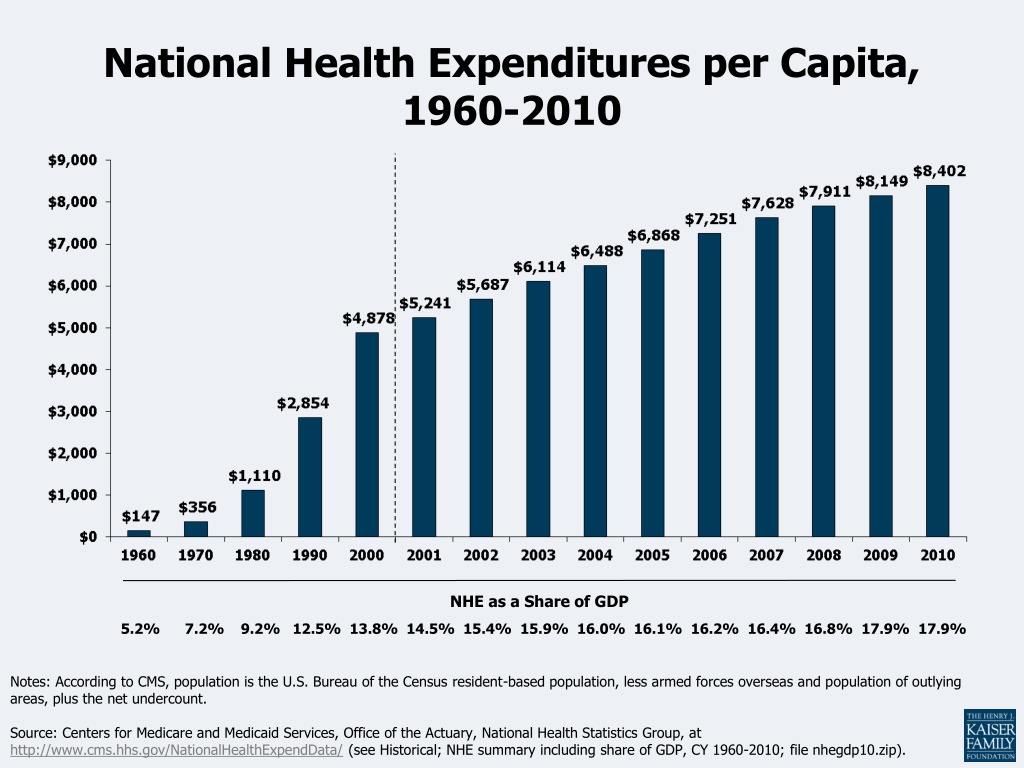
National Health Expenditures per Capita, 1960-2010 NHE as a Share of GDP 5.2% 7.2% 9.2% 12.5% 13.8% 14.5% 15.4% 15.9% 16.0% 16.1% 16.2% 16.4% 16.8% 17.9% 17.9% Notes: According to CMS, population is the U.S. Bureau of the Census resident-based population, less armed forces overseas and population of outlying areas, plus the net undercount. Source: Centers for Medicare and Medicaid Services, Office of the Actuary, National Health Statistics Group, at http://www.cms.hhs.gov/NationalHealthExpendData/ (see Historical; NHE summary including share of GDP, CY 1960-2010; file nhegdp10.zip).
Concentration of Health Care Spending in the U.S. Population, 2009 Percent of Total Health Care Spending ( $51,951) ( $17,402) ( $9,570) ( $6,343) ( $4,586) ( $851) (<$851) Note: Dollar amounts in parentheses are the annual expenses per person in each percentile. Population is the civilian noninstitutionalized population, including those without any health care spending. Health care spending is total payments from all sources (including direct payments from individuals and families, private insurance, Medicare, Medicaid, and miscellaneous other sources) to hospitals, physicians, other providers (including dental care), and pharmacies; health insurance premiums are not included. Source: Kaiser Family Foundation calculations using data from U.S. Department of Health and Human Services, Agency for Healthcare Research and Quality, Medical Expenditure Panel Survey (MEPS), Household Component, 2009.
Average Annual Growth Rates for Health Spending and GDP Per Capita Plus 2.4 Plus 1.0 Projected Source: Historical data from Centers for Medicare and Medicaid Services, Office of the Actuary, National Health Statistics Group.
Putting Off Care Because of Cost Percent who say they or another family member living in their household have done each of the following because of the cost: Relied on home remedies or over-the-counter drugs instead of going to see a doctor 38% 35% Skipped dental care or checkups Put off or postponed getting health care needed 29% 24% Not filled a prescription for a medicine Skipped a recommended medical test or treatment 25% 16% Cut pills in half or skipped doses of medicine Had problems getting mental health care 8% Yes to any of the above 58% Source: Kaiser Family Foundation Health Tracking Poll (conducted May 8-14, 2012).
Per Capita Total Current Health Care Expenditures, U.S. and Selected Countries, 2010 ^ 2009 data Notes: Amounts in U.S.$ Purchasing Power Parity, see www.oecd.org/std/ppp; includes only countries over $2,500. OECD defines Total Current Expenditures on Health as the sum of expenditures on personal health care, preventive and public health services, and health administration and health insurance; it excludes investment. Source: Organisation for Economic Co-operation and Development. OECD Health Data: Health Expenditures and Financing , OECD Health Statistics Data from internet subscription database. http://www.oecd-library.org, data accessed on 08/23/12.
Average Annual Worker and Employer Contributions to Premiums and Total Premiums for Family Coverage Source: Kaiser/HRET Survey of Employer-Sponsored Health Benefits, 2002-2012.