Understanding Engineering Costs and Estimation Methods


Engineering
Cost
and
Estimation
Sayantan Sarkar
Engineering
Costs
Fixed
Cost:
These
constant
or
unchanging
regardless
of
the
level
of
output
or
activity.
Example: In production environment, costs for factory floor space and
equipment remains the same regardless of production quantity, rent, insurance
premiums, or loan payments.
Variable Costs:
These are not constant and depends in level of out or activity.
Example: Piece rate labor, Commissions, incentives.
Semi Variable cost:
A cost contains both fixed and variable component and which
is thus partly affected by fluctuations in the level of activity. Semi-variable costs
is that cost of which some part remains fixed at the given level of production and
other part varies with the change in the volume of production but not in the same
proportion of change in production. For example, Telephone expenses of which
rent portion is fixed and call charges are variable
Variable cost per unit = change in cost/change in output
Example:
If the cost of production of 2000 units is Rs.26,000 and 25000 units is Rs.30,000.
Variable cost per unit
= (30000 – 26000)/(2500 – 2000)
= 4000/500 = Rs.8 per unit.
Variable cost of 2000 units
= 2000 × 8 = Rs. 16,000
Fixed cost = Total cost- variable cost = Rs.26,000-Rs. 16,000 = Rs.10,000
Total cost:
It is the summation of the total fixed cost and total variable
cost.
Average cost
:
It is total cost divided by number of units
Marginal cost
: MC is the change in total cost associated a change in output.
Engineering
Costs
5
Let’s
take
example
of
two
student
enrolled
in
engineering
one
is
full
time
while
other
is
a
part
time.
student
A
full
time
student
can
enroll
in
12-18
credit
hours
for
a
fixed
fee
of
$1800.
Overload
credits
are
charged
at
$120/credit
Full-time
student
:
It
is
the
case
of
fixed
cost,
regardless
of
number
of
credit
hours
he has
to
pay
tuition
fee.
Fixed
cost
:
$1800
per
semester
for
12-18
credits
Avg.
cost
1
if
student
chooses
12
credits:
1800/12=
$150/credit
Avg.
cost
2
if
student
chooses
18
credits:
1800/18=
$
100/credit
Variable
cost
:
cost
of addition
credit
beyond
18
Variable
cost
for
addition
credit
beyond18:
$120
Example
Example
Total
Cost=
Total
Fixed
cost
+
Total
Variable
cost
Engineering
Costs
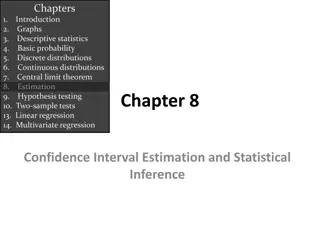
Profit-loss
breakeven
chart.
It
is
plot
of
revenue
against
costs
for
various
level
of
outputs
(activity).
It
allows
to
understand breakpoint
and
region
of
profit
and
loss.
Terminologies:
Break-even
point:
the
level
of
activity
at
which
total
cost
of
product/goods/services
equals
to
revenue
Profit
region:
values
of
variable
x
greater
than
break
point where
total revenue
is
greater
than
total
cost
Loss
region:
Values
of
variable
x
less
than
breakpoint
where
total
revenue
is
less
than
total
cost
Profit
loss
breakeven
chart
figure
here
Engineering
Costs
(Example
continued)
So here
:
Breakeven
point:
15
students
Profit
region:
for
more
than 15,
F
SSe
will
be
in
profit
Loss
region:
For
less
than 15,
FSSe
will
be
in
loss
Engineering
Costs
Sunk
Cost:
A
sunk
cost
is
money
already
spent
as
a
result
of
past
decision.
e.g.,
(i)
If
5
students
signed
up
for
the engineering
course
than
,
the
advertising
cost
would
be
sunk
cost
(ii).
Price
of
two
years
old
pc
purchase
at
$2000
is
sunk
cost
which
has
no
influence
on
current
market
value
of
$400
of
pc
10
Engineering
Costs
Opportunity
cost:
An
opportunity
cost
is
associated
with using
a
resource
in
one
activity
instead
of
another.
Opportunity cost
refers to the value
forgone
in order to make one
particular investment instead of another.
For example, let's assume you have Rs. 5 lakh that you could either
invest in Company A stock or put toward a graduate degree. You
choose the stock. The opportunity cost in this situation is the
increased lifetime earnings that may have resulted from getting the
graduate degree -- that is, you choose to forgo the increase in
earnings when you use the money to buy stock instead.
11
Opportunity
cost: example-
Suppose a man has invested a sum of s. 50,000 in shares. Let the
expected annual return by this alternative be Rs. 4500.
If the same amount is invested in real estate, a return of 10% is
expected.
Then the corresponding total return per year for the investment in real
estate is Rs 5000. This return is greater than the return from shares.
The foregone excess return of Rs. (5000-4500) = Rs. 500 by way of not
investing in real estate is the
opportunity cost
of investing in shares.
Recurring
and
Nonrecurring
costs
Recurring costs
refers
to any expense that is know and
anticipated and that occurs at regular interval. Eg: monthly rent,
bills
Non recurring costs
are
one-time expenses that occur at
irregular intervals and thus are sometimes difficult to plan for or
anticipate from a budgeting perspective. Eg: initial outlay of a
company, cost of renovation of a building
In engineering economics analysis, recurring costs are modeled as
cash flow that occur at regular interval. Nonrecurring costs can also
be handled if we are able to anticipate their timing and size.
13
Engineering
Costs
A
cash
cost
is a cash transaction, or cash flow. If a company purchases an
asset, it realizes a cash cost.
A
book
cost
is not a cash flow, but it is an accounting entry that represents
some change in value.
When a company records a depreciation charge of $4 million in a tax
year, no money changes hands. However, the company is saying in effect
that the market value of its physical, depreciable assets has decreased
by $4 million during the year.
Life-cycle
costs
refer to costs that occur over the various phases of a
product or service life cycle, from needs assessment through design,
production, and operation to decline and retirement.
Cost
Estimating
Engineering economic analysis focuses on future consequences of
present decisions and therefore one must estimate all cost related
variables
Estimates for engineering economic analysis include purchase costs,
annual revenue, yearly maintenance, interest rates for investments,
annual labor and insurance costs and tax rates etc
Types
of
Estimates
1.
Rough
Estimate
2.
Semi-detailed
estimate
3.
Detailed
estimate
15
Types
of
Estimates
1.
Rough
Estimates:
These are order of magnitude estimate used for
high level planning for determining project feasibility and in a
project initial planning and evaluation phase.
These estimates require minimum resources to develop and
their accuracy is
-30
to
60%.
2.
Semi-detailed
estimates:
These are used for budgeting purpose at
a project’s conceptual or preliminary design stage. These are more
detailed than rough but still require time and resources.
Their accuracy is generally
-15
to
20%
3.
Detailed
estimates:
These are used during project detailed design
and contract bidding phases. These involve most time and
resources and thus are much more accurate than rough estimates.
The accuracy is general
-3
to
5%
16
Difficulties
in
Estimation
One of a kind estimates:
The first time something is done, it is
difficult to estimate costs required to design, produce, and
maintain a product over its life cycle.
E.g., NASA first space mission, promotional cost of a new
product.
Time
and
effort
available:
Our ability to develop engineering
estimates is constrained by the time and man-power availability
Estimator
Expertise:
The more experienced and knowledgeable
the estimator is, the more accurate the estimate will be.
17
Estimating Models
1. Per unit model
2. Segmenting model
3. Cost indexes
4. Power-sizing model
5. Improvement and learning curve
18
Estimating
Models
1.
Per-unit
model:
It is a simple but useful model in which a cost estimate is made
for a single unit, then the total cost estimate results from
multiplying the estimated cost per unit times the number of
units.
It is commonly used in construction industry.
Example:
Cost of Rs.65 per square meter
Service cost per customer
Gasoline cost per km
19
Estimating
Models
2. Segmenting model:
It can be described as “Divide and Conquer“.
It partitions the total estimation task into segments. Each
segment is estimated, then the segment estimates are
combined for the total cost estimate.
An estimate is decomposed into its individual components,
estimates are made at those lower levels, and then the
estimates are aggregated (added) back together.
It is much easier to estimate at the lower levels because they
are more readily understood.
20
Estimating
Models
3. Cost indexes:
It can be used to account for historical changes in costs. The widely
reported Consumer Price Index (CPI) is an example.
Cost index data are available from a variety of sources.
Suppose A is a time point in the past and B is the current time. Let
IVA denote the index value at time A and IVB denote the current
index value for the cost estimate of interest. To estimate the current
cost based on the cost at time A, use the equation:
(Cost at time B)/ (Cost at time A) = (IVB / IVA)
=> Cost at time B = (Cost at time A) (IVB / IVA
)
21
Example
Miriam is interested in estimating the annual labour and material
costs for a new production facility. She was able to obtain the
following labour and material cost data:
Labour costs:
Labour cost index value 10 years ago was at 124 and is 188 today
Annual labour cost for a similar facility 10 years ago was Rs. 575,500
Material Costs:
Material cost index value was at 544 three years ago and is 715 today
Annual material cost for a similar facility was Rs. 2,455,000 three year
ago
Find out the present annual labour and material cost.
22
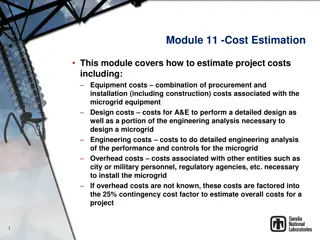
Example
- Solution
23
Miriam
will
use
cost
index
equation
for estimating the present
annual
labor
and
material
cost
.
12
4
Index
value10
years
ago
Index
value
today
Annual
cost
10
years
ago
Index
value10
years
ago
Annual
cost
today
Index
value
today
Annual
cost
today
575500
188
Rs.
871800
Annual
cost
today
Annual
cost
10
years
ago
54
4
Annual
cost
3
years
ago
Index
value
3
years
ago
Annual
cost
today
Index
value
today
Annual
cost
today
2455000
715
Rs.
3227000
A
n
n
u
al
Labor
Cost
Annual
M
a
t
e
r
i
al
Cost
Estimating
Models
4. Power-sizing model:
It accounts explicitly for economies of scale.
For example, the cost of constructing a six-story building will typically be less
than double the construction cost of a comparable three-story building.
To estimate the cost of B based on the cost of comparable item A, use the
equation:
Cost
of
B /
(Cost
of
A)
=
[
("Size" of
B)
/
("Size" of
A)
]
x
where
'
x’
is the appropriate power-sizing exponent, available from a
variety of sources.
An economy of scale is indicated by an exponent less than 1.0.
An exponent of 1.0 indicates no economy of scale, and an exponent
greater than 1.0 indicates a diseconomy of scale.
"Size" is used here in a general sense to indicate physical size, capacity,
or some other appropriate comparison unit.
24
Example
Miriam has been asked to estimate the today’s cost of a 2500 sq. ft
heat exchange system for the new plant being analysed. She has the
following data:
Her company paid Rs.50000 for a 1000 sq. ft heat exchanger 5
years ago. Heat exchangers within this range of capacity has a
power sizing exponent (x) of 0.55.
Five years ago the Heat Exchanger Cost Index (HECI) was 1306; it is
1487 today
Solution:
Miriam will use the following equation of power sizing model;
Cost of 2500 sq. ft = (Cost of 1000ft2) [ ("Size" of 2500ft2) / ("Size" of 1000ft2) ] ^xwhere x =0.55
Cost of 2500 sq. ft equipment = (50000) [ (2500) / (1000) ]^ 0.55
Cost of 2500 sq. ft equipment =Rs. 82,800
25
…continue:
Example
Miriam knows that the Rs. 82,800 reflects only the scaling up
of the cost of the 1000 ft2 model to 2500 ft2 model. Now she
will use following equation of cost index model to determine
the today’s cost of equipment
26
1306
Equipment
cost
today
Index
value
today
Equipment cost
5
years
ago
Index
value
5
years
ago
Annual
cost today
82800
1487
Rs.
94,300
P
r
o
b
l
e
m
Paresh works for a trade magazine that publishes lists of
Power-Sizing
Exponent (PSE)
that reflects economies of scale for developing engineering
estimates of various types of equipment. Paresh has been unable to find any
published data on the VMIC machine and wants to list its PSE value in his
next issue. Given the following data, calculate the PSE that Paresh should
publish w.r.t. 50 KW generator machine.
Cost of 100 KW m/c today= $100,000
Cost of 50 KW m/c 10 years ago=$45,000
Generator index today= 856
Generator index 10 years ago=604
27
..
P
r
o
b
l
e
m
:
Solution
•
Using
Cost
Index
Model
Cost of 50 KW m/c today = 45,000 (856/604) = $63,775
•
Using
Power
Sizing
Model:
28
Estimating
Models
5.
Improvement
and
the
learning
curve
One common phenomenon observed, regardless of the
task being performed, is that as the number of repetitions
increases, performance becomes faster and more accurate.
This is the concept of learning and improvement in the
activities that people perform.
The learning curve captures the relationship between task
performance and task repetition.
The learning curve shows that if a task is performed over and
over than less time will be required at each iteration.
29
Learning curve
cost estimating is based on the assumption that as a particular task is repeated,
the operator systematically becomes quicker at performing the task.
The learning curve slope indicates "how fast" learning occurs.
The following expression can be used for time estimating in repetitive tasks
Example:
A learning curve rate is 70%, the operator’s time for the first t unit is 65 seconds. What is
the operator’s time for the 50
th
unit?
Sol
: b = log (0.70) / log 2.0 = -0.5145 T
50
= T
1
* (50) ^ b = 65 * (50) ^ -0.5145 = 8.68 mins.
Solved Example
•
Calculate the time to required to produce the hundredth unit
of a production run if the first unit took 32 minute to
produce and the learning curve rate for production is 80%.
Problem:
If 200 labour hours were required to produce the 1st unit in a production
run and 60 labour hours were required to produce the 7th unit, what was
the learning curve rate during production.
T
N =
T
1
* (N) ^ b
==>
T(7)
60
0
.
30
0
=
T(1)
x
7
b
=
(200)
x
7
b
=
7
b
log
0.30=
b
log
(7)
b
=
log
(0.30)/log
(7)
=
-0.62
log
(learning
curve
rate)
=
-0.187
b
=
[log
(learning
curve
rate)/lob
2.0]
=
-0.62
=
10
(-0.187)
learning
curve
rate
=
.650
=
65%
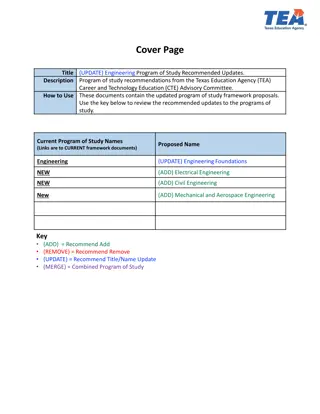
When thousands or even millions of units are being
produced, the learning curve effect is ignored/vanished at a
time/stage called
steady state
.
Number
of
units
t
i
m
e
Steady
state
Steady state is the time at
which the
physical
constraints of performing
the task prevent the
achievement of any more
learning or improvement.
This informative content delves into the concept of engineering costs and estimations, covering important aspects such as fixed costs, variable costs, semi-variable costs, total costs, average costs, marginal costs, and profit-loss breakeven charts. It provides clear explanations and examples to help grasp these fundamental principles in the field of engineering economics.

Download Presentation

Please find below an Image/Link to download the presentation.
The content on the website is provided AS IS for your information and personal use only. It may not be sold, licensed, or shared on other websites without obtaining consent from the author. Download presentation by click this link. If you encounter any issues during the download, it is possible that the publisher has removed the file from their server.
E N D
Presentation Transcript
Engineering Cost and Estimation Sayantan Sarkar
Engineering Costs Fixed Cost:These constant or unchanging regardless of the level of output or activity . Example: In production environment, costs for factory floor space and equipment remains the same regardless of production quantity, rent, insurance premiums, or loan payments. Variable Costs: These are not constant and depends in level of out or activity. Example: Piece rate labor, Commissions, incentives. Semi Variable cost: A cost contains both fixed and variable component and which is thus partly affected by fluctuations in the level of activity. Semi-variable costs is that cost of which some part remains fixed at the given level of production and other part varies with the change in the volume of production but not in the same proportion of change in production. For example, Telephone expenses of which rent portion is fixed and call charges are variable Variable cost per unit = change in cost/change in output
Example: If the cost of production of 2000 units is Rs.26,000 and 25000 units is Rs.30,000. Variable cost per unit = (30000 26000)/(2500 2000) = 4000/500 = Rs.8 per unit. Variable cost of 2000 units = 2000 8 = Rs. 16,000 Fixed cost = Total cost- variable cost = Rs.26,000-Rs. 16,000 = Rs.10,000
Total cost: It is the summation of the total fixed cost and total variable cost. Average cost: It is total cost divided by number of units Marginal cost : MC is the change in total cost associated a change in output.
Engineering Costs Let s take example of two student enrolled in engineering one is full time while other is a part time. student A full time student can enroll in 12-18 credit hours for afixedfeeof$1800. Overload creditsarechargedat $120/credit Full-time student: It is the case of fixed cost, regardless of number of credit hours he has to pay tuition fee. Fixed cost: $1800 per semester for 12-18credits Avg. cost 1 if student chooses 12 credits: 1800/12=$150/credit Avg. cost 2 if student chooses 18 credits: 1800/18= $ 100/credit Variable cost: cost of addition credit beyond 18 Variable cost for addition credit beyond18:$120 5
Example Total Cost=Total Fixed cost +TotalVariable cost
Engineering Costs Profit-loss breakeven chart. It is plot of revenue against costs for various level of outputs (activity). It allows to understand breakpoint and region of profit and loss. Profit loss breakeven chart figure here Terminologies: Break-even point: the level of activity at which total cost of product/goods/services equals to revenue Profit region: values of variable x greater than break point where total revenue is greater than total cost Loss region:Values of variable x less than breakpoint where total revenue is less than total cost
Engineering Costs (Example continued) So here: Breakeven point: 15students Profit region: for more than 15, FSSe will be in profit Loss region: For less than 15,FSSe will be in loss
Engineering Costs Sunk Cost: A sunk cost is money already spent as a result of past decision. e.g., (i) If 5 students signed up for the engineering course than, the advertising cost would be sunk cost (ii). Price of two years old pc purchase at $2000 is sunk cost which has no influence on current market value of $400 of pc 10
Engineering Costs Opportunity cost: An opportunity cost is associated with using a resource in one activity instead of another. Opportunity cost refers to the value forgone in order to make one particular investment instead of another. For example, let's assume you have Rs. 5 lakh that you could either invest in Company A stock or put toward a graduate degree. You choose the stock. The opportunity cost in this situation is the increased lifetime earnings that may have resulted from getting the graduate degree -- that is, you choose to forgo the increase in earnings when you use the money to buy stock instead. 11
Opportunity cost: example- Suppose a man has invested a sum of s. 50,000 in shares. Let the expected annual return by this alternative be Rs. 4500. If the same amount is invested in real estate, a return of 10% is expected. Then the corresponding total return per year for the investment in real estate is Rs 5000. This return is greater than the return from shares. The foregone excess return of Rs. (5000-4500) = Rs. 500 by way of not investing in real estate is the opportunity cost of investing in shares.
Recurring and Nonrecurring costs Recurring costs refersto any expense that is know and anticipated and that occurs at regular interval. Eg: monthly rent, bills Non recurring costs areone-time expenses that occur at irregular intervals and thus are sometimes difficult to plan for or anticipate from a budgeting perspective. Eg: initial outlay of a company, cost of renovation of a building In engineering economics analysis, recurring costs are modeled as cash flow that occur at regular interval. Nonrecurring costs can also be handled if we are able to anticipate their timing and size. 13
Engineering Costs A cash cost is a cash transaction, or cash flow. If a company purchases an asset, it realizes a cash cost. A book cost is not a cash flow, but it is an accounting entry that represents some change in value. When a company records a depreciation charge of $4 million in a tax year, no money changes hands. However, the company is saying in effect that the market value of its physical, depreciable assets has decreased by $4 million during the year. Life-cycle costs refer to costs that occur over the various phases of a product or service life cycle, from needs assessment through design, production, and operation to decline and retirement.
Cost Estimating Engineering economic analysis focuses on future consequences of present decisions and therefore one must estimate all cost related variables Estimates for engineering economic analysis include purchase costs, annual revenue, yearly maintenance, interest rates for investments, annual labor and insurance costs and tax rates etc Types of Estimates 1. Rough Estimate 2. Semi-detailed estimate 3. Detailed estimate 15
Types of Estimates 1. Rough Estimates: These are order of magnitude estimate used for high level planning for determining project feasibility and in a project initial planning and evaluation phase. These estimates require minimum resources to develop and their accuracy is -30 to 60%. 2. Semi-detailed estimates: These are used for budgeting purpose at a project s conceptual or preliminary design stage. These are more detailed than rough but still require time and resources. Their accuracy is generally -15 to 20% 3. Detailed estimates: These are used during project detailed design and contract bidding phases. These involve most time and resources and thus are much more accurate than rough estimates. The accuracy is general -3 to 5% 16
Difficulties in Estimation One of a kind estimates: The first time something is done, it is difficult to estimate costs required to design, produce, and maintain a product over its life cycle. E.g., NASA first space mission, promotional cost of a new product. Time and effort available: Our ability to develop engineering estimates is constrained by the time and man-power availability Estimator Expertise: The more experienced and knowledgeable the estimator is, the more accurate the estimate will be. 17
Estimating Models 1. Per unit model 2. Segmenting model 3. Cost indexes 4. Power-sizing model 5. Improvement and learning curve 18
Estimating Models 1. Per-unit model: It is a simple but useful model in which a cost estimate is made for a single unit, then the total cost estimate results from multiplying the estimated cost per unit times the number of units. It is commonly used in construction industry. Example: Cost of Rs.65 per square meter Service cost per customer Gasoline cost per km 19
Estimating Models 2. Segmenting model: It can be described as Divide and Conquer . It partitions the total estimation task into segments. Each segment is estimated, then the segment estimates are combined for the total cost estimate. An estimate is decomposed into its individual components, estimates are made at those lower levels, and then the estimates are aggregated (added) back together. It is much easier to estimate at the lower levels because they are more readily understood. 20
Estimating Models 3. Cost indexes: It can be used to account for historical changes in costs. The widely reported Consumer Price Index (CPI) is an example. Cost index data are available from a variety of sources. Suppose A is a time point in the past and B is the current time. Let IVA denote the index value at time A and IVB denote the current index value for the cost estimate of interest. To estimate the current cost based on the cost at time A, use the equation: (Cost at time B)/ (Cost at time A) = (IVB / IVA) => Cost at time B = (Cost at time A) (IVB / IVA) 21
Example Miriam is interested in estimating the annual labour and material costs for a new production facility. She was able to obtain the following labour and material cost data: Labour costs: Labour cost index value 10 years ago was at 124 and is 188 today Annual labour cost for a similar facility 10 years ago was Rs. 575,500 Material Costs: Material cost index value was at 544 three years ago and is 715 today Annual material cost for a similar facility was Rs. 2,455,000 three year ago Find out the present annual labour and material cost. 22
Example - Solution Miriam will use cost index equation for estimating the present annual labor and material cost. Annualcost today Index valuetoday Annual Labor Cost = Annualcost10 yearsago Index value10 yearsago Index valuetoday Annualcost today =Annualcost10 yearsago Index value10 yearsago Annualcost today = 575500188= Rs. 871800 124 Annual Material Cost Annualcost today Index valuetoday = Annualcost 3yearsago Annualcost today = 2455000 715 = Rs.3227000 Index value3yearsago 544 23
Estimating Models 4. Power-sizing model: It accounts explicitly for economies of scale. For example, the cost of constructing a six-story building will typically be less than double the construction cost of a comparable three-story building. To estimate the cost of B based on the cost of comparable item A, use the equation: Cost of B / (Cost of A) = [ ("Size" of B) / ("Size" of A) ] x where 'x is the appropriate power-sizing exponent, available from a variety of sources. An economy of scale is indicated by an exponent less than 1.0. An exponent of 1.0 indicates no economy of scale, and an exponent greater than 1.0 indicates a diseconomy of scale. "Size" is used here in a general sense to indicate physical size, capacity, or some other appropriate comparison unit. 24
Example Miriam has been asked to estimate the today s cost of a 2500 sq. ft heat exchange system for the new plant being analysed. She has the following data: Her company paid Rs.50000 for a 1000 sq. ft heat exchanger 5 years ago. Heat exchangers within this range of capacity has a power sizing exponent (x) of 0.55. Five years ago the Heat Exchanger Cost Index (HECI) was 1306; it is 1487 today Solution: Miriam will use the following equation of power sizing model; Cost of 2500 sq. ft = (Cost of 1000ft2) [ ("Size" of 2500ft2) / ("Size" of 1000ft2) ] ^x where x =0.55 Cost of 2500 sq. ft equipment = (50000) [ (2500) / (1000) ]^ 0.55 Cost of 2500 sq. ft equipment =Rs. 82,800 25
continue: Example Miriam knows that the Rs. 82,800 reflects only the scaling up of the cost of the 1000 ft2 model to 2500 ft2 model. Now she will use following equation of cost index model to determine the today s cost of equipment Equipment cost today Equipment cost 5yearsago Index valuetoday Index value5yearsago = Annualcost today =828001487= Rs. 94,300 1306 26
Problem Paresh works for a trade magazine that publishes lists of Power-Sizing Exponent (PSE) that reflects economies of scale for developing engineering estimates of various types of equipment. Paresh has been unable to find any published data on the VMIC machine and wants to list its PSE value in his next issue. Given the following data, calculate the PSE that Paresh should publish w.r.t. 50 KW generator machine. Cost of 100 KW m/c today= $100,000 Cost of 50 KW m/c 10 years ago=$45,000 Generator index today= 856 Generator index 10 years ago=604 27
..Problem: Solution Using Cost Index Model Cost of 50 KW m/c today = 45,000 (856/604) = $63,775 Using Power Sizing Model: (63,775/100,000) log (0.63775) = x log(0.50) = (50/100)x x = 0.65 28
Estimating Models 5. Improvement and the learning curve One common phenomenon observed, regardless of the task being performed, is that as the number of repetitions increases, performance becomes faster and more accurate. This is the concept of learning and improvement in the activities that people perform. The learning curve captures the relationship between task performance and task repetition. The learning curve shows that if a task is performed over and over than less time will be required at each iteration. 29
Learning curve cost estimating is based on the assumption that as a particular task is repeated, the operator systematically becomes quicker at performing the task. The learning curve slope indicates "how fast" learning occurs. The following expression can be used for time estimating in repetitive tasks Example: A learning curve rate is 70%, the operator s time for the first t unit is 65 seconds. What is the operator s time for the 50thunit? Sol: b = log (0.70) / log 2.0 = -0.5145 T50= T1* (50) ^ b = 65 * (50) ^ -0.5145 = 8.68 mins.
Solved Example Calculate the time to required to produce the hundredth unit of a production run if the first unit took 32 minute to produce and the learning curve rate for production is 80%.
Problem: If 200 labour hours were required to produce the 1st unit in a production run and 60 labour hours were required to produce the 7th unit, what was the learning curve rate during production. ==> T(7) 60 0.300 log 0.30= b log (7) b =T(1) x 7b = (200) x7b = 7b TN =T1* (N) ^ b = log (0.30)/log(7) = -0.62 b = [log (learning curve rate)/lob 2.0] = -0.62 log (learning curve rate) learning curve rate = -0.187 = 10(-0.187) = .650 = 65%
When thousands or even millions of units are being produced, the learning curve effect is ignored/vanished at a time/stage called steady state. Steady state is the time at which the physical constraints of performing the task prevent the achievement of any more learning or improvement. time Steadystate Number ofunits