Understanding Municipal Water Demand Fluctuations
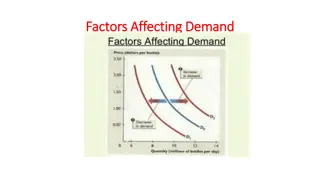
There is a wide variation in seasonal, daily, and hourly water demands for municipal water supply. Factors like working days, weather conditions, and time of day influence the demand patterns. Analysis of average demand, maximum day demand, and peak hourly demand is crucial for capacity planning of treatment plants and service pumps. The ratios of maximum demand to average flow vary by city, necessitating individualized studies. Equations are used for estimating demand ratios in the absence of specific data.

Download Presentation

Please find below an Image/Link to download the presentation.
The content on the website is provided AS IS for your information and personal use only. It may not be sold, licensed, or shared on other websites without obtaining consent from the author. Download presentation by click this link. If you encounter any issues during the download, it is possible that the publisher has removed the file from their server.
E N D
Presentation Transcript
There is a wide variation in seasonal, daily and hourly water demands. Some of the general observations of municipal water demands can be summarized as follows: Working days have higher demand than holidays. Hot and dry days have more demand than wet and cold days. Maximum moths are typically July andAugust (summer). Within a day, there are two demand peaks, one peak is in the morning as the day activities start, the other peak is at evening.
The average demand represents the average daily demand over one year; it is often referred to as annual average daily demand. The maximum day demand represents amount of water required during the day of maximum consumption during a year. The maximum demand is particularly sensitive to the weather conditions.
Maximum demand and peak hourly demand is usually expressed as a ratio to the mean average daily flow. These ratios vary greatly for different cities; therefore, a careful study for each city must be done from the past data to develop this flocculation. In the absence of water demand data, the following equation is used to estimate the ratio of maximum month, week, day and hour demand.
? = 180 ? 0.1 P : percent of the annual average demand for time (t) , t : time (day) varies from 2/24 to 365. The average and maximum daily demand is required to analyze the peak capacity of the treatment plant, while peak hour is used to analyze the maximum capacity required of the high service pumps to be able to deliver peak water demand during the peak hour of the day.