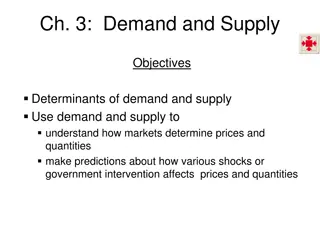
Understanding Supply and Demand in Competitive Markets

Supply and Demand are crucial forces in market economies that determine prices and quantities of goods. This content explores the concept of competitive markets, the relationship between demand and price, and the impact of related goods on demand. It delves into market dynamics through examples such as changes in petrol prices due to war and variations in mango prices based on agricultural output. Additionally, it explains the law of demand, market structures, and the concept of market demand using a practical example of potato market demand analysis.

Download Presentation

Please find below an Image/Link to download the presentation.
The content on the website is provided AS IS for your information and personal use only. It may not be sold, licensed, or shared on other websites without obtaining consent from the author. Download presentation by click this link. If you encounter any issues during the download, it is possible that the publisher has removed the file from their server.
E N D
Presentation Transcript
Business in Competitive Markets. 9th of October
Markets and Competition What happens To the price of petrol when war breaks out in Iran To the price of mangoes when farmers have an abundant year To the number of tourists when the tsunami hit Sri-Lanka All of the above show the workings of Supply and Demand Supply and Demand are the forces that make market economies work. They determine the following Quantity of Goods produced Price of which goods are sold
What is a Market? A group of buyers and sellers of a particular good or service. Characteristics of markets Organized markets Less Organized markets. A competitive market is a market which has many buyers and sellers so that each has a negligible impact on price. For today s class we will assume that markets are perfectly competitive. The goods offered for sale are exactly the same so that no single buyer or seller has influence over price.
Demand Quantity Demanded the amount of a good that buyers are willing and are able to pay. Law of Demand The claim that other things equal the quantity Demanded of a good falls when the price of The good increases. Market Demand the sum of all individual demand for a particular good or service Teach a parrot the terms 'supply and demand' and you've got an economist. Thomas Carlyle
Demand Relationship between demand and price the law of demand the income effect the substitution effect The demand curve constructing the demand curve individual and market demand curves assumptions
Price of Related Goods Substitutes Two goods for which an increase in price of one leads to an increase in demand for the price of the other Complements Two goods for which an increase in the price of one leads to a decrease in demand for the other.
Market demand for potatoes (monthly) Market demand (tonnes 000s) 700 500 350 200 100 Point Price E 100 (pence per kg) 20 40 60 80 100 A B C D E D Price (pence per kg) 80 C 60 B 40 A 20 Demand 0 0 100 200 300 Quantity (tonnes: 000s) 400 500 600 700 800
Demand Other determinants of demand tastes number and price of substitute goods number and price of complementary goods income distribution of income expectations
Demand Movements along and shifts in the demand curve change in price movement along D curve change in any other determinant of demand shift in D curve increase in demand rightward shift decrease in demand leftward shift
An increase in demand Possible causes of a rise in demand Tastes shift towards this product Rise in price of substitute goods Fall in price of complementary goods Rise in income Expectations of a rise in price PriceP D0 D1 O Q0 Q1 Quantity
Supply Quantity Supplied The amount of a good that sellers are willing and able to sell. Law of Supply The claim that other things equal the quantity Supplied of a good increase when the price of The good increases.
Market supply of potatoes (monthly) 100 e Supply d P Q 100 200 350 530 700 80 20 40 60 80 100 a b c d e Price (pence per kg) c 60 b 40 a 20 0 0 100 200 300 400 500 600 700 800 Quantity (tonnes: 000s)
Supply Other determinants of supply costs of production profitability of alternative products (substitutes in supply) profitability of goods in joint supply nature and other random shocks aims of producers expectations of producers
Supply Movements along and shifts in the supply curve change in price movement along S curve change in any other determinant of supply shift in S curve increase in supply rightward shift decrease in supply leftward shift
Shifts in the supply curve P S0 Possible causes of a rise in supply Fall in costs of production Reduced profitability of alternative products that could be supplied Increased profitability of goods in joint supply Benign shocks Expectations of a fall in price S1 Increase O Q
Shifts in the supply curve P S2 S0 S1 Decrease Increase O Q
Price and Output Determination Equilibrium price and output response to shortages and surpluses shortage (D > S) price rises surplus (S > D) price falls significance of equilibrium
Equilibrium price and output: The market demand and supply of potatoes (monthly) Price of potatoes (pence per kilo) Total market demand (tonnes: 000s) Total market supply (tonnes: 000s) 20 700 (A) 100 (a) 40 500 (B) 200 (b) 60 350 (C) 350 (c) 80 200 (D) 530 (d) 100 100 (E) 700 (e)
The determination of market equilibrium (potatoes: monthly) e E 100 Supply d D 80 Price (pence per kg) c C 60 b B 40 a A 20 Demand 0 0 100 200 300 Quantity (tonnes: 000s) 400 500 600 700 800
The determination of market equilibrium (potatoes: monthly) e E 100 Supply d D 80 Price (pence per kg) c C 60 b SHORTAGE B 40 (300 000) a A 20 Demand 0 0 100 200 300 Quantity (tonnes: 000s) 400 500 600 700 800
The determination of market equilibrium (potatoes: monthly) e E 100 Supply d D SURPLUS 80 Price (pence per kg) (330 000) c C 60 b B 40 a A 20 Demand 0 0 100 200 300 Quantity (tonnes: 000s) 400 500 600 700 800
The determination of market equilibrium (potatoes: monthly) e E 100 Supply d D 80 Price (pence per kg) 60 b B 40 a A 20 Demand 0 Qe 0 100 200 300 Quantity (tonnes: 000s) 400 500 600 700 800
Effect of a shift in the demand curve P S i Pe2 g h Pe1 D2 D1 O Qe1 Qe2 Q
Effect of a shift in the supply curve P S2 S1 k Pe3 j g Pe1 D O Qe3 Qe1 Q
Surplus and Shortage Surplus A situation where Qs is greater than Qd Shortage A situation where Qd is greater than Qs No change in Supply An increase in supply Decrease in supply No change in demand P.Q No change P down Q up P up Q down Increase in Demand P up Q up P ambiguous Q up P is up Q ambiguous Decrease in demand P down Q down P down Q ambiguous P ambiguous Q down
Production Possibilities Frontier A graph that shows the combinations of output that the economy can possibly produce given the available factors of production and the available production technology. Example Economy can produce 300 shirts or 100 cakes Producing at the PPF causes the market to be efficient It is easy to see trade offs and opportunity costs Opportunity Cost = the slope of the PPF Line Slope = Change in Y/ Change in X 300-0/100/0 = 3
Price Elasticity of Demand The responsiveness of demand to a change in price The responsiveness of demand for an individual firm In a competitive market individual firms are too small to have any influence on the market price. In some other situation, firms may have some discretion in choosing their prices. Firms want to know how much the quantity demanded will fall if price is increased.
Elasticity of Supply and Demand Price Elasticity of Demand We use absolute numbers even though Qd is negatively related to its price. |Ped|= Q/ P = 20/10 = 2
Different Types of Demand Perfectly Inelastic Demand Inelastic Demand Unitary Elastic Demand Elastic Demand Perfectly Elastic Demand
Determinants of Price Elasticity Sustainability Nature of the Product Proportion of Income Definition of Market The Possibility of new purchases Time Horizons Addiction Complementary goods Price expectations
Market demand curve for an individual firm under perfect competition P D Pm O Q
The demand (market) for an individual firms product P P 10 7 6 6 D2 D1 O O 90 100 50 100 Q Q Firm B Firm A
Importance of Price Elasticity of Demand to Business Decision Making Price elasticity of demand and a firm s sales revenue (TR = P x Q) Elastic demand and sales revenue Inelastic demand and sales revenue
Total expenditure 4 3 2 P( ) Consumers total expenditure = firms total revenue = 2 x 3m = 6m 0 1 1 D 0 2 3 4 5 Q (millions of units per period of time)
Importance of Price Elasticity of Demand to Business Decision Making Price elasticity of demand and a firm s sales revenue (TR = P x Q) effects of a price change on sales revenue elastic demand TR changes in same direction as quantity
Elastic demand between two points Expenditure falls as price rises P( ) b 5 a 4 D 0 20 10 Q (millions of units per period of time)
Importance of Price Elasticity of Demand to Business Decision Making Price elasticity of demand and a firm s sales revenue (TR = P x Q) effects of a price change on sales revenue elastic demand TR changes in same direction as quantity inelastic demand TR changes in same direction as price
Inelastic demand between two points Expenditure rises as price rises. c 8 P( ) a 4 D 0 15 20 Q (millions of units per period of time)
Importance of Price Elasticity of Demand to Business Decision Making Price elasticity of demand and a firm s sales revenue (TR = P x Q) effects of a price change on sales revenue elastic demand TR changes in same direction as quantity inelastic demand TR changes in same direction as price applications to price decisions special cases totally inelastic demand
Totally inelastic demand (PD= 0) P D b P2 a P1 Q1 O Q
Importance of Price Elasticity of Demand to Business Decision Making Price elasticity of demand and a firm s sales revenue (TR = P x Q) effects of a price change on sales revenue elastic demand TR changes in same direction as quantity inelastic demand TR changes in same direction as price applications to price decisions special cases totally inelastic demand infinitely elastic demand
Infinitely elastic demand (PD = ) P a b D P1 Q2 Q1 O Q
Importance of Price Elasticity of Demand to Business Decision Making Price elasticity of demand and a firm s sales revenue (TR = P x Q) effects of a price change on sales revenue elastic demand TR changes in same direction as quantity inelastic demand TR changes in same direction as price applications to price decisions special cases totally inelastic demand infinitely elastic demand unit elastic demand
Unit elastic demand (PD = 1) P Expenditure stays the same as price changes. a 20 b 8 D 100 40 O Q
Other Elasticities of Demand Income elasticity of demand % QD / % Y measurement determinants degree of necessity of the good rate at which desire is satisfied level of income of consumers applications to business importance of perceptions of the product repositioning a product
Other Elasticities of Demand Cross-price elasticity of demand % QDa / % Pb measurement determinants closeness of complements or substitutes time period applications to business effects of changes in competitors' pricing strategy strategies to make a product less cross-price elastic
Price elasticity of supply Price elasticity of supply refers to the responsiveness of supply to a change in price. Similar to demand, price elasticity of supply can be elastic or inelastic.
Price Elasticity of Supply Meaning of price elasticity of supply Measuring price elasticity of supply elastic and inelastic supply Determinants of price elasticity of supply amount that costs rise as output increases time period immediate short run long run % QS / % P
Response of supply to an increase in demand P Sshort-run Slong-run b P2 c P3 P1 Supply is more elastic in the long run. a D2 D1 Q1 Q2 Q3 O Q
Q The short-run (retail) supply of freshly cut flowers is much less elastic than that of pot plants because: A. B. C. D. households generally keep pot plants much longer before throwing them away. fresh flowers are more likely to be purchased for special occasions. the price of freshly cut flowers fluctuates much more than that of pot plants. supplies of fresh flowers fluctuate much more with the weather and the season. florists cannot keep freshly cut flowers as long as pot plants. E.


")


")


 for an individual firm’s product")


")

")

")


 supply of freshly cut flowers is")