Enersponse Inc. Demand Response Programs Summary
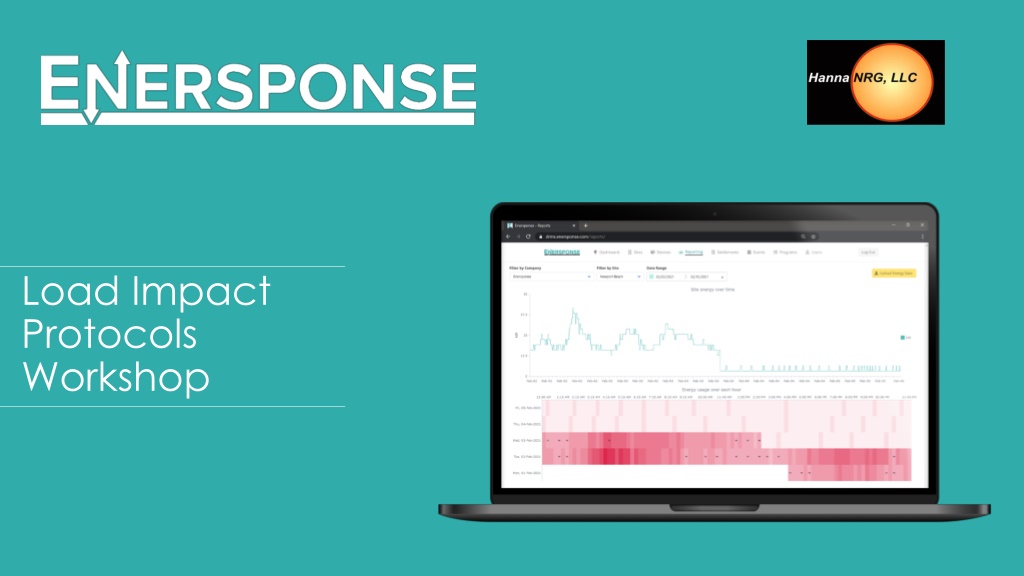
Load Impact
Protocols
Workshop
PROGRAM BACKGROUND
About
Enersponse Inc is a Demand Response Aggregator, and Auto-DR Integrator, managing nearly 18,000
commercial, industrial, agricultural and municipal water pumping locations across North America.
Enersponse manages customer participation by way of their DERMs platform, connecting to end-
use customer controls via a library of software integrations, including custom API’s and OpenADR.
While some Enersponse customers are dispatched using traditional methods (email & sms/text
notifications) most of their resources are direct-control.
Enersponse has been actively participating in various California Demand Response programs since
2015. The customer accounts included in this report have been actively managed by Enersponse in
California demand response programs during 2021 program year.
EVENTS & DISPATCH
EVENT PARTICIPATION BY LOAD TYPE
EX POST RESULTS
EX POST METHODOLOGY
Enersponse has elected to use performance results from its clients in
California that have participated in the 2021 program year.
For the ex-post analysis, baseline loads were estimated using
individual regression modeling. Different model configurations were
tested for accuracy and bias to determine the best fit. Once the
consumer baselines were calculated, the consumer load impacts were
calculated by subtracting the baseline loads in each hour from the
consumer’s actual load in that hour during the event
.
COMBINED EX POST
AVERAGE IMPACTS – AUGUST 30, 2021
Event Start Time:
16:00
Event End Time:
18:00
AVERAGE IMPACTS – February 17, 2021
Event Start Time:
17:00
Event End Time:
21:00
EX-ANTE RESULTS
EX ANTE METHODOLOGY
The ex-ante load impacts were estimated for the DR resource for
typical event days and monthly peak days from 2022 through 2032.
The ex-ante analysis uses the average percent load drop by end-use,
LCA, and season from the ex-post results. This was done because there
wasn’t a strong correlation between load impact and other factors,
mainly ambient temperature. These load impact predictors were then
combined with the Enersponse’s predicted resource changes to
estimate potential future impacts.
EX-ANTE IMPACT ESTIMATORS
ENROLLMENT FORECATS (H/M/L)
ENROLLMENT FORECASTS (H/M/L)
EX-ANTE – PUMPING AUGUST EVENT DAY 2022
EX-ANTE – HVAC AUGUST EVENT DAY 2022
COMBINED EX-ANTE RESULTS
EX-ANTE RESULTS BY LCA
FUTURE RECOMMENDATIONS
It has been challenging to develop accurate and
unbiased reference loads for customers with pumping
loads. These customers tend to be irregular in their
load levels and the timing of the changes in load are
difficult to predict. However, in aggregate the
individual regression baselines are reasonably
accurate.
Future evaluations need to continue to seek
to improve the estimation of the individual baselines.
QUESTIONS
Enersponse Inc. is a Demand Response Aggregator managing a large number of commercial, industrial, agricultural, and municipal water pumping locations in North America. They utilize a DERMs platform and various software integrations to manage customer participation efficiently. The company actively participates in California Demand Response programs, with customer accounts managed during the 2021 program year. The summary includes details about workshops, program background, company information, events & dispatch schedules, event participation by load type, ex-post results, and methodology. Enersponse's approach involves individual regression modeling to estimate baseline loads and calculate load impacts. The report provides valuable insights into their performance and contributions to Demand Response initiatives.

Download Presentation

Please find below an Image/Link to download the presentation.
The content on the website is provided AS IS for your information and personal use only. It may not be sold, licensed, or shared on other websites without obtaining consent from the author.If you encounter any issues during the download, it is possible that the publisher has removed the file from their server.
You are allowed to download the files provided on this website for personal or commercial use, subject to the condition that they are used lawfully. All files are the property of their respective owners.
The content on the website is provided AS IS for your information and personal use only. It may not be sold, licensed, or shared on other websites without obtaining consent from the author.
E N D
Presentation Transcript
Load Impact Protocols Workshop
About Enersponse Inc is a Demand Response Aggregator, and Auto-DR Integrator, managing nearly 18,000 commercial, industrial, agricultural and municipal water pumping locations across North America. Enersponse manages customer participation by way of their DERMs platform, connecting to end- use customer controls via a library of software integrations, including custom API s and OpenADR. While some Enersponse customers are dispatched using traditional methods (email & sms/text notifications) most of their resources are direct-control. Enersponse has been actively participating in various California Demand Response programs since 2015. The customer accounts included in this report have been actively managed by Enersponse in California demand response programs during 2021 program year.
EVENTS & DISPATCH Event Day Event Start Event End Duration # of Accts 13 Jan 2021 4:00 PM 5:00 PM 1 hr. 76 17 Feb 2021 5:00 PM 9:00 PM 4 hrs. 467 10 March 2021 4:00 PM 5:00 PM 1 hr. 76 14 April 2021 4:00 PM 5:00 PM 1 hr. 76 12 May 2021 4:00 PM 5:00 PM 1 hr. 76 9 June 2021 4:00 PM 5:00 PM 1 hr. 76 18 June 2021 6:00 PM 8:00 PM 2 hrs. 499 12 July 2021 4:00 PM 6:00 PM 2 hrs. 499 14 July 2021 4:00 PM 5:00 PM 1 hr. 76 30 August 2021 4:00 PM 6:00 PM 2 hrs. 409 31 August 2021 4:00 PM 6:00 PM 2 hrs. 76 8 Sept 2021 4:00 PM 5:00 PM 1 hr. 76 9 Sept 2021 6:00 PM 8:00 PM 2 hrs. 525 13 October 2021 4:00 PM 5:00 PM 1 hr. 76 15 October 2021 4:00 PM 6:00 PM 2 hrs. 525
EVENT PARTICIPATION BY LOAD TYPE Event HVAC Pumping Total 13 Jan 2021 0 76 76 17 Feb 2021 258 209 467 10 March 2021 0 76 76 14 April 2021 0 76 76 12 May 2021 0 76 76 9 June 2021 0 76 76 18 June 2021 288 211 499 12 July 2021 288 211 499 14 July 2021 0 76 76 30 August 2021 286 123 409 31 August 2021 0 76 76 8 Sept 2021 0 76 76 9 Sept 2021 288 237 525 13 October 2021 0 76 76 15 October 2021 288 237 525
EX POST METHODOLOGY Enersponse has elected to use performance results from its clients in California that have participated in the 2021 program year. For the ex-post analysis, baseline loads were estimated using individual regression modeling. Different model configurations were tested for accuracy and bias to determine the best fit. Once the consumer baselines were calculated, the consumer load impacts were calculated by subtracting the baseline loads in each hour from the consumer s actual load in that hour during the event.
COMBINED EX POST Mean Customer Impact (kW) Mean Reference Load (kw) Relative Curtailment (%) Hourly Temperature during Event # of Accts Event 13 Jan 2021 76 38.6 13.3 34.4 70.2 17 Feb 2021 467 72.6 13.6 18.7 57.6 10 March 2021 76 31.4 13.8 43.8 48.3 14 April 2021 76 46.9 21.1 45.0 60.0 12 May 2021 76 66.5 38.8 58.3 76.1 9 June 2021 76 61.0 27.0 44.1 73.3 18 June 2021 499 110.6 19.6 17.8 82.2 12 July 2021 499 114.5 27.2 23.8 87.8 14 July 2021 76 78.2 40.0 51.2 87.0 30 August 2021 409 107.2 19.7 18.4 84.7 31 August 2021 76 61.1 28.8 47.1 76.6 8 Sept 2021 76 60.5 26.1 43.1 88.5 9 Sept 2021 525 113.8 26.1 22.9 85.5 13 Oct 2021 76 54.9 27.5 50.1 69.1 15 Oct 2021 525 92.9 14.4 15.5 78.5
AVERAGE IMPACTS AUGUST 30, 2021 Estimated Reference Load (kW) Observed Event Day Load (kW) Impact 120 100 Event Start Time: 16:00 80 Event End Time: 18:00 60 Load 40 20 0 -20 1 2 3 4 5 6 7 8 9 10 11 12 13 14 15 16 17 18 19 20 21 22 23 24 Hour Ending
AVERAGE IMPACTS February 17, 2021 Estimated Reference Load (kW) Observed Event Day Load (kW) Impact 90 80 Event Start Time: 17:00 70 60 Event End Time: 21:00 50 Load 40 30 20 10 0 -10 1 2 3 4 5 6 7 8 9 10 11 12 13 14 15 16 17 18 19 20 21 22 23 24 Hour Ending
EX ANTE METHODOLOGY The ex-ante load impacts were estimated for the DR resource for typical event days and monthly peak days from 2022 through 2032. The ex-ante analysis uses the average percent load drop by end-use, LCA, and season from the ex-post results. This was done because there wasn t a strong correlation between load impact and other factors, mainly ambient temperature. These load impact predictors were then combined with the Enersponse s predicted resource changes to estimate potential future impacts.
EX-ANTE IMPACT ESTIMATORS Season LCA End-use % Load Impact HVAC 2.462% Big Creek / Ventura Pumping 40.781% Non-Summer HVAC 7.862% LA Basin Pumping 48.773% HVAC 7.538% Big Creek / Ventura Pumping 61.154% Summer HVAC 10.279% LA Basin Pumping 56.460%
ENROLLMENT FORECATS (H/M/L) Year Low Medium High 1,256 1,256 1,256 2022 1,455 1,633 1,796 2023 1,669 2,123 2,569 2024 1,918 2,760 3,640 2025 2,203 3,588 5,111 2026 2,529 4,665 7,110 2027 2,905 6,065 9,798 2028 3,335 7,885 13,376 2029 3,826 10,250 18,083 2030 4,390 13,325 24,213 2031 5,038 17,323 32,108 2032
ENROLLMENT FORECASTS (H/M/L) Low Medium High 35,000 30,000 25,000 20,000 15,000 10,000 5,000 0 2022 2023 2024 2025 2026 2027 2028 2029 2030 2031
EX-ANTE PUMPING AUGUST EVENT DAY 2022 Estimated Reference Load (MW) Estimated Event Day Load (MW) Impact 90 80 70 60 50 Load 40 30 20 10 0 1 2 3 4 5 6 7 8 9 10 11 Hour Ending 12 13 14 15 16 17 18 19 20 21 22 23 24
EX-ANTE HVAC AUGUST EVENT DAY 2022 Estimated Reference Load (MW) Estimated Event Day Load (MW) Impact 90 80 70 60 50 Load 40 30 20 10 0 -10 1 2 3 4 5 6 7 8 9 10 11 Hour Ending 12 13 14 15 16 17 18 19 20 21 22 23 24
COMBINED EX-ANTE RESULTS Year 2022 2023 2024 2025 2026 2027 2028 2029 2030 2031 2032 HVAC (MW) 5.7 7.2 9.1 11.7 15.2 19.7 25.6 33.3 43.3 56.3 73.2 Pumping (MW) 26.4 34.3 44.4 57.8 75.2 97.7 127.0 165.2 214.6 279.0 362.7 Total (MW) 32.1 41.5 53.5 69.5 90.4 117.4 152.6 198.5 257.9 335.3 2467.9
EX-ANTE RESULTS BY LCA Mean Impact (kW) CAISO Peak SCE Peak # of Aggregate Impact (MW) 1-in-2 1-in-10 1-in-2 1-in-10 LCA Big Creek / Ventura Accounts 146 9.4 1.4 14 13 13 13 LA Basin 805 40.5 45.0 33 33 34 33 Total 912 38.2 46.3 32 32 32 32
FUTURE RECOMMENDATIONS It has been challenging to develop accurate and unbiased reference loads for customers with pumping loads. These customers tend to be irregular in their load levels and the timing of the changes in load are difficult to predict. However, in aggregate the individual regression baselines are reasonably accurate. Future evaluations need to continue to seek to improve the estimation of the individual baselines.


")
")