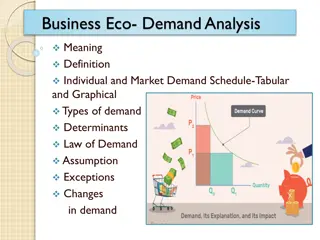
Understanding the Market Force of Demand

Demand is essential in economics, representing the quantity buyers are willing to purchase at different prices. The Law of Demand asserts that as prices rise, demand falls. Through demand schedules and curves, we analyze how factors like price, number of buyers, income, and related goods influence demand, causing shifts in the demand curve. Explore how these demand curve shifters impact market dynamics.

Download Presentation

Please find below an Image/Link to download the presentation.
The content on the website is provided AS IS for your information and personal use only. It may not be sold, licensed, or shared on other websites without obtaining consent from the author. Download presentation by click this link. If you encounter any issues during the download, it is possible that the publisher has removed the file from their server.
E N D
Presentation Transcript
THE MARKET FORCE OF DEMAND
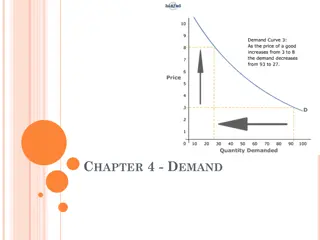
Demand The quantity demanded of any good is the amount of the good that buyers are willing and able to purchase. Law of demand: the claim that the quantity demanded of a good falls when the price of the good rises, other things equal 2
The Demand Schedule Price of lattes $0.00 1.00 2.00 3.00 4.00 5.00 6.00 Quantity of lattes demanded 24 18 16 12 9 6 3 Demand schedule: a table that shows the relationship between the price of a good and the quantity demanded Example: Helen s demand for lattes. Notice that Helen s preferences obey the Law of Demand. 3
Helens Demand Schedule & Curve Price of lattes $0.00 1.00 2.00 3.00 4.00 5.00 6.00 Quantity of lattes demanded 24 18 16 12 9 6 3 Price of Lattes $6.00 $5.00 $4.00 $3.00 $2.00 $1.00 $0.00 Quantity of Lattes 0 5 10 15 4
Demand Curve Shifters The demand curve shows how price affects quantity demanded, other things being equal. These other things are non-price determinants of demand (i.e., things that determine buyers demand for a good, other than the good s price). Changes in them shift the D curve 7
Demand Curve Shifters: # of Buyers Increase in # of buyers increases quantity demanded at each price, shifts D curve to the right. 8
Demand Curve Shifters: # of Buyers Suppose the number of buyers increases. Then, at each P, Qdwill increase (by 5 in this example). P $6.00 $5.00 $4.00 $3.00 $2.00 $1.00 Q $0.00 0 5 10 15 20 25 30 9
Demand Curve Shifters: Income Demand for a normal good is positively related to income. Increase in income causes increase in quantity demanded at each price, shifts D curve to the right. (Demand for an inferior good is negatively related to income. An increase in income shifts D curves for inferior goods to the left.) 10
Demand Curve Shifters: Prices of Related Goods Two goods are substitutes if an increase in the price of one causes an increase in demand for the other. Example: pizza and hamburgers. An increase in the price of pizza increases demand for hamburgers, shifting hamburger demand curve to the right. Other examples: Coke and Pepsi, laptops and desktop computers, CDs and music downloads 11
Demand Curve Shifters: Prices of Related Goods Two goods are complements if an increase in the price of one causes a fall in demand for the other. Example: computers and software. If price of computers rises, people buy fewer computers, and therefore less software. Software demand curve shifts left. Other examples: college tuition and textbooks, bagels and cream cheese, eggs and bacon 12
Demand Curve Shifters: Tastes Anything that causes a shift in tastes toward a good will increase demand for that good and shift its D curve to the right. Example: The Atkins diet became popular in the 90s, caused an increase in demand for eggs, shifted the egg demand curve to the right. 13
Demand Curve Shifters: Expectations Expectations affect consumers buying decisions. Examples: If people expect their incomes to rise, their demand for meals at expensive restaurants may increase now. If the economy sours and people worry about their future job security, demand for new autos may fall now. 14
Summary: Variables That Influence Buyers Variable A change in this variable Price causes a movement along the D curve # of buyers shifts the D curve Income shifts the D curve Price of related goods shifts the D curve Tastes shifts the D curve Expectations shifts the D curve 15