Exploring Usability Testing of New Interface in JMP Custom Design
In this study by Mark Bailey et al. from JMP Statistical Discovery in the USA, the focus lies on testing the usability of a new user interface using JMP Custom Design. The researchers highlight the significance of adding factors in the initial experiment design workflow to enhance user experience. User pain points are addressed, emphasizing the importance of a smooth user interface design process.

Download Presentation

Please find below an Image/Link to download the presentation.
The content on the website is provided AS IS for your information and personal use only. It may not be sold, licensed, or shared on other websites without obtaining consent from the author. Download presentation by click this link. If you encounter any issues during the download, it is possible that the publisher has removed the file from their server.
E N D
Presentation Transcript
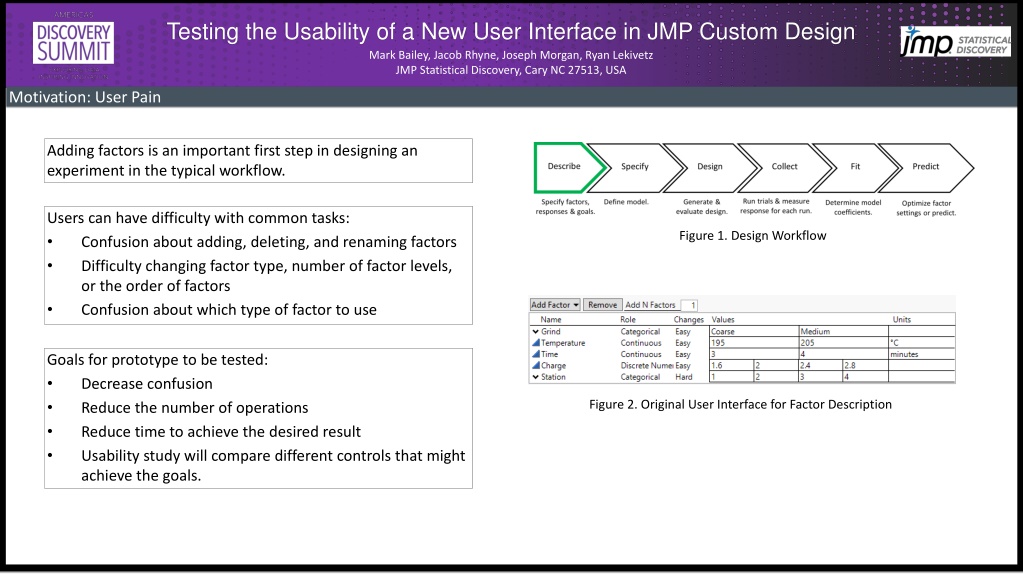
Testing the Usability of a New User Interface in JMP Custom Design Mark Bailey, Jacob Rhyne, Joseph Morgan, Ryan Lekivetz JMP Statistical Discovery, Cary NC 27513, USA Motivation: User Pain Adding factors is an important first step in designing an experiment in the typical workflow. Users can have difficulty with common tasks: Confusion about adding, deleting, and renaming factors Difficulty changing factor type, number of factor levels, or the order of factors Confusion about which type of factor to use Figure 1. Design Workflow Goals for prototype to be tested: Decrease confusion Reduce the number of operations Reduce time to achieve the desired result Usability study will compare different controls that might achieve the goals. Figure 2. Original User Interface for Factor Description
Testing the Usability of a New User Interface in JMP Custom Design Mark Bailey, Jacob Rhyne, Joseph Morgan, Ryan Lekivetz JMP Statistical Discovery, Cary NC 27513, USA Methodology: Flexible Prototype The prototype may be configured in many ways by turning several user interface controls on and off. Configurability leads to 384 possible configurations. A practical usability study required a smaller optimal design Figure 3. Configurable Prototype of New User Interface for Factor Description The options for the user interface include: 1. Trash icon 2. Delete icon 3. Plus button 4. Undo / Redo buttons 5. Add N Factors control 6. Buffet Menu button Figure 4. Two Example Configurations
Testing the Usability of a New User Interface in JMP Custom Design Mark Bailey, Jacob Rhyne, Joseph Morgan, Ryan Lekivetz JMP Statistical Discovery, Cary NC 27513, USA Methodology: Design of Experiments Used Custom Design in JMP to make runs for the usability study. Some UI controls are treated as binary factors (on/off) Other UI controls have more than two states User asked to perform several different tasks repeatedly with different configurations. Name Pin Column Trash Icon Delete Icon Buffet Icon Toolbar Type Pin Column Type Row States Task Levels On, Off On, Off On, Off On, Off (+/ ), Add N Factors, Both Pin, Oval, Copy, Oval+Copy On, Off Delete, Change Type, Change Position Sets tasks for subjects Description Row icon (in)visible Trash icon (in)visible Delete icon (in)visible Buffet icon (in)visible Sets controls to add factors Set row icons Sets row highlighting Figure 5. Custom Design Specification for Usability Study
Testing the Usability of a New User Interface in JMP Custom Design Mark Bailey, Jacob Rhyne, Joseph Morgan, Ryan Lekivetz JMP Statistical Discovery, Cary NC 27513, USA Methodology: Design of Experiments The custom design was combined with special runs. Special tasks complicated and not repeated Last two runs contrast the current and proposed UI Participant and Run Order are included as covariates Developed custom JSL application for unmoderated test. Each row in the design presents an exercise and prototype Exercises include instructions for the task Figure 6. All Runs in a Usability Study for One Subject Figure 7. A Run Determines Presentation of Exercise and Prototype
Testing the Usability of a New User Interface in JMP Custom Design Mark Bailey, Jacob Rhyne, Joseph Morgan, Ryan Lekivetz JMP Statistical Discovery, Cary NC 27513, USA Qualitative Results: Preferences The study survey revealed a range of user preferences. Plus button over Add N Factors control Delete icon over Trash icon Pin icon over Oval icon Prototype over existing interface Figure 8. Preferences from Integrated Questionnaire
Testing the Usability of a New User Interface in JMP Custom Design Mark Bailey, Jacob Rhyne, Joseph Morgan, Ryan Lekivetz JMP Statistical Discovery, Cary NC 27513, USA Quantitative Results: Change Factor Order Important factors Levels that minimized Time Oval On On NA (learning not important) Pin Column Type (Icon Choice) Trash Icon Row States Run Order Figure 9. Regression Analysis and Response Profiles for Changing Factor Order Figure 10. Subjects Preferred the Pin Icon over the Oval Icon, or They Had No Preference.
Testing the Usability of a New User Interface in JMP Custom Design Mark Bailey, Jacob Rhyne, Joseph Morgan, Ryan Lekivetz JMP Statistical Discovery, Cary NC 27513, USA Quantitative Results: Deleting Factors Important factors Levels that minimized Time Remove Type Delete Icon Run Order Time decreased over the runs (Subject learning) Figure 11. Regression Analysis and Response Profiles for Deleting Factors Figure 12. Subjects Preferred the Delete Icon over the Trash Can
Testing the Usability of a New User Interface in JMP Custom Design Mark Bailey, Jacob Rhyne, Joseph Morgan, Ryan Lekivetz JMP Statistical Discovery, Cary NC 27513, USA Overall Result: Current Custom Design versus New Prototype Figure 13. Time to Complete the Same Set of Tasks is Much Less Using the New Prototype