Trends in Nitrate Concentrations in Suffolk County Public Water-Supply Wells 1982-2008
This study analyzes trends in nitrate concentrations in public water-supply wells in Suffolk County, New York, from 1982 to 2008. Groundwater is a crucial source of drinking water, with potential impacts on coastal waters. The analysis reveals increasing nitrate trends over both long and short terms, with a significant percentage of wells showing elevated concentrations. The research underscores the importance of long-term quantitative assessments for groundwater management and protection.

Download Presentation

Please find below an Image/Link to download the presentation.
The content on the website is provided AS IS for your information and personal use only. It may not be sold, licensed, or shared on other websites without obtaining consent from the author. Download presentation by click this link. If you encounter any issues during the download, it is possible that the publisher has removed the file from their server.
E N D
Presentation Transcript
Trends in Nitrate Concentrations in Public Water-Supply Wells, Suffolk County, New York, 1982-2008 Irene J. Fisher and Patrick J. Phillips U.S. Geological Survey 21stLong Island Geologists Conference Stony Brook University April 12, 2014
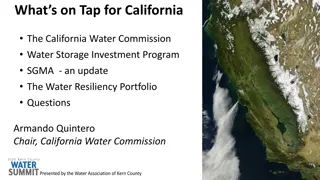
Points of Interest: Groundwater is our sole source of drinking water Groundwater is considered to be an important source of nitrogen to coastal waters Previous studies have indicated potential increase in nitrate over time Long-term quantitative assessments tend to be rare Quantitative assessment can aid in targeting important groundwater contributions
Statistical analysis background 700+ SCWA wells over the last 50 yrs were scanned for which suitable and sufficient data exist between 1982-2008 264 wells (95 Magothy; 169 upper glacial) were used in the statistical analysis for trend Representative value (nitrate concentration) for each well Two time periods: Long Term (1982-2008) Mann-Kendall Short Term (1982-1994) Mann-Kendall Regional Kendall
Long Term Groundwater Nitrate Trends Suitable data spans between 1982 to 2008 Break in data between the years 1997 to 1999
Percentage of wells with increasing, decreasing, or no discernable trend UPPER GLACIAL AQUIFER MAGOTHY AQUIFER 120 120 Percentage of wells with indicated trend Percentage of wells with indcated trend 100 66 59 126 100 100 80 80 60 60 40 40 20 20 0 0 Long Short Long Short > 75 % of wells in both aquifers have increasing, long term trends > 40% of wells in both aquifers have increasing, short term trends
Nitrate Concentration Ranges Upper Glacial Aquifer Long Term Short Term 120 120 100 100 PERCENTAGE OF WELLS WITH PERCENTAGE OF WELLS WITH 80 80 INDICATED TREND INDICATED TREND 60 60 40 40 20 20 0 0 low moderate high low moderate high low: < 1 mg/L moderate: > 1 mg/L to < 5 mg/L high: > 5 mg/L
Nitrate Concentration Ranges Magothy Aquifer Long Term Short Term 120 120 120 120 100 100 100 100 PERCENTAGE OF WELLS WITH PERCENTAGE OF WELLS WITH 80 80 INDICATED TREND 80 80 INDICATED TREND 60 60 60 60 40 40 40 40 20 20 20 20 0 0 0 low moderate high 0 low moderate high low: < 1 mg/L moderate: > 1 mg/L to < 5 mg/L high range: > 5 mg/L
Rate of Change Aquifer Period UGL LT UGL ST MG MG Median 90th percentile 0.070 0.094 0.068 0.071 0.17 0.23 0.19 0.26 LT ST Median: general tendency 90th: highest rate of change Some wells are increasing at a rate of 2 mg/L over a decade
Regional-Kendall test Assessment of whether a consistent trend occurs at many of the sampling locations within a region Inclusion of uncensored data only Five regions based on sewerage, land use (including population density), and hydrogeologic factors Northwest (NW) Southwest unsewered (SW-UN) Southwest sewered (SW-SE) Central (CE) Eastern (EA)
Upper Glacial Aquifer, Long Term (1982-2008) Map & bar chart ! ( Regional Trend # * ! ( # * ! ( # * # * # * # * # * # * ! ( ! ( ! ( # * # * # * # * # * ! ( # * # * # * ! ( # * # * # * # * # * EA # * # * # * # * # * # * # * ! ( # * # * # * # * # * # * ! ( # * # * # * ! ( NW CE # * # * # * # * # * # * # * ! ( ! ( # * # * # * # * ! ( # *# * # * # * # * # * # * # * # * ! ( # * # * # * # * # * # * # * # * # * # * # * # * # * ! ( ! ( # * # * # * ! ( ! ( # * SW-UN # * # * # * # * # * ! ( ! ( 120 SW-SE 100 PERCENTAGE OF WEILLS WITH INDICATED TREND 80 60 Increasing trend Decreasing trend No trend 40 20 0 NW SW-UN SW-SE CE EA
Upper Glacial Aquifer, Long Term (1982-2008) Map & bar chart ! ( # * ! ( # * ! ( # * # * Number of wells in region # * # * # * # * ! ( ! ( ! ( # * # * # * # * # * ! ( # * # * # * ! ( # * # * # * # * # * EA # * # * # * # * # * # * # * ! ( # * # * # * # * # * # * ! ( # * # * # * ! ( NW CE # * # * # * # * # * # * # * ! ( ! ( # * # * # * # * ! ( # *# * # * # * # * # * # * # * # * ! ( # * # * # * # * # * # * # * # * # * # * # * # * # * ! ( ! ( # * # * # * ! ( ! ( # * SW-UN # * # * # * # * # * ! ( ! ( 120 SW-SE 100 PERCENTAGE OF WEILLS WITH INDICATED TREND 80 60 Increasing trend Decreasing trend No trend 40 20 0 NW SW-UN SW-SE CE EA
Upper Glacial Aquifer, Long Term (1982-2008) Increasing trends for 3 of the regions > 70% of wells in NW and CE have increasing trends 25% of wells in EA have decreasing trends Map & bar chart ! ( # * ! ( # * ! ( # * # * # * # * # * # * ! ( ! ( ! ( # * # * # * # * # * ! ( # * # * # * ! ( # * # * # * # * # * EA # * # * # * # * # * # * # * ! ( # * # * # * # * # * # * ! ( # * # * # * ! ( NW CE # * # * # * # * # * # * # * ! ( ! ( # * # * # * # * ! ( # *# * # * # * # * # * # * # * # * ! ( # * # * # * # * # * # * # * # * # * # * # * # * # * ! ( ! ( # * # * # * ! ( ! ( # * SW-UN # * # * # * # * # * ! ( ! ( 120 SW-SE 100 PERCENTAGE OF WEILLS WITH INDICATED TREND 80 60 Increasing trend Decreasing trend No trend 40 20 0 NW SW-UN SW-SE CE EA
Upper Glacial Aquifer, Short Term (1982-1994) # * ! ( Increasing trends for 3 of the regions 70% of wells in NW have increasing trends ! ( # * # * # * ! ( # * ! ( # * # * # * ! ( ! ( # * ! ( # * # * ! ( ! ( # * ! ( ! ( ! ( # * # * ! ( ! ( # * ! ( # * NW ! ( ! ( ! ( EA # * ! ( # * # * # * # * # * CE ! ( # * # * # * # * # * # * # * ! ( ! ( ! ( ! ( ! (# * ! (! ( ! ( ! ( # * # * ! ( # * # * # * # * ! ( # * # * ! ( ! ( ! ( ! ( # * # * # * # * # * # * ! ( ! ( ! ( # * # * # * # * ! ( ! ( ! ( ! ( ! ( ! ( ! ( # * # * ! ( # * # * ! ( ! ( ! ( ! ( ! ( ! ( # * ! ( # * ! ( ! ( ! ( ! ( ! ( ! ( SW-UN ! ( # * ! ( ! ( ! ( ! ( ! ( ! ( ! ( ! ( ! ( 120 ! ( ! ( SW-SE 100 ERCENTAGE OF WEILLS WITH P 80 INDICATED TREND 60 Increasing trend Decreasing trend No trend 40 20 0 NW SW-UN SW-SE CE EA
Magothy Aquifer, Long Term (1982-2008) 4 out 5 regions have increasing trends 1 well had a decreasing trend # * # * # * # * # * # * ! ( # * # * # * # * # * ! ( ! ( # * ! ( # * # * ! ( # * # * # * # * # * # * # * # * # * # * # * EA # * # * # * # * CE # * # * # * # * # * # * # * # * # * NW # * # * # * # * # * # * # * ! ( ! ( # * # * # * # * # * # * # * # * SW-UN ! ( # * ! ( # * # * # * 120 SW-SE 100 PERCENTAGE OF WEILLS WITH 80 INDICATED TREND 60 Increasing trend Decreasing trend No trend 40 20 0 NW SW-UN SW-SE CE EA
Magothy Aquifer, Short Term (1982-1994) 3 regions have increasing trends No wells exhibited a decreasing trend # * # * # * ! ( # * ! ( ! ( ! ( # * ! ( # * ! ( # * ! ( ! ( # * # * # * ! (# * # * # * # * EA ! ( ! ( # * CE # * # * # * # * # * NW ! ( # * ! ( # * # * # * # * # * ! ( ! ( ! ( # * # * ! ( # * # * ! ( ! ( ! ( ! ( ! ( # * SW-UN # * ! ( ! ( ! ( # * ! ( 120 SW-SE 100 PERCENTAGE OF WEILLS WITH 80 INDICATED TREND 60 Increasing trend Decreasing trend No trend 40 20 0 NW SW-UN SW-SE CE EA
Summary This analysis only included SCWA wells Many wells have significant increasing trends in nitrate concentrations, more so in the Magothy than the upper glacial The long term analysis (1982-2008) has the greatest number of wells with increasing trends for both aquifers Most of the representative concentrations for any of the analyses are in the moderate range (> 1mg/L to < 5 mg/L) Some wells have an increase in nitrate concentrations at the rate of 2mg/L per decade There were no regional trend decreases for any of the analyses Two regions, NW and CE, have regional trend increases for each aquifer and time period Future analysis will include an assessment of the pumpage management for the same time periods
For more information Irene J. Fisher ifisher@usgs.gov Patrick J. Phillips Troy Program Office pjphilli@usgs.gov USGS New York Water Science Center Coram, NY 11727 (631) 736 - 0783